


Asian Indices:
- Australia's ASX 200 index rose by 25.5 points (0.36%) and currently trades at 7,040.70
- Japan's Nikkei 225 index has risen by 24.89 points (0.07%) and currently trades at 33,433.28
- Hong Kong's Hang Seng index has fallen by -344.13 points (-1.98%) and currently trades at 17,010.01
- China's A50 Index has fallen by -82.01 points (-0.7%) and currently trades at 11,693.84
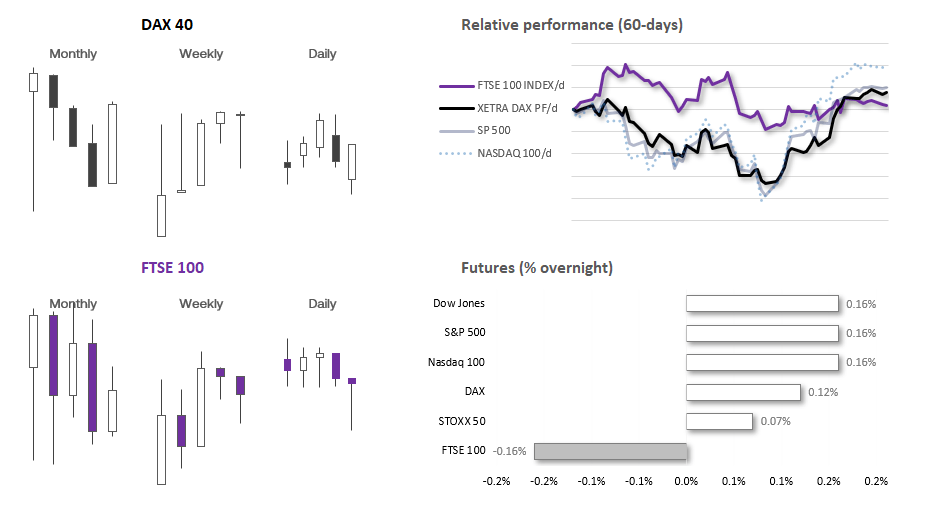
UK and European indices:
- UK's FTSE 100 futures are currently down -11.5 points (-0.15%), the cash market is currently estimated to open at 7,443.74
- Euro STOXX 50 futures are currently up 3 points (0.07%), the cash market is currently estimated to open at 4,351.02
- Germany's DAX futures are currently up 19 points (0.12%), the cash market is currently estimated to open at 16,011.67
US index futures:
- DJI futures are currently up 60 points (0.17%)
- S&P 500 futures are currently up 7.25 points (0.16%)
- Nasdaq 100 futures are currently up 26 points (0.16%)
Events in focus (GMT):
- 08:00 – Spanish CPI
- 09:00 – Italian business confidence
- 09:00 – German State CPIs
- 09:30 – UK consumer credit (BOE), M3 money supply (BOE), lending data
- 10:00 – European Economic Sentiment indicator, German state CPI
- 12:00 – US mortgage data, 30-year mortgage rate
- 13:00 – German CPI
- 13:30 – US GDP, PCE prices, consumer spending
- 18:45 – FOMC member Mester speaks
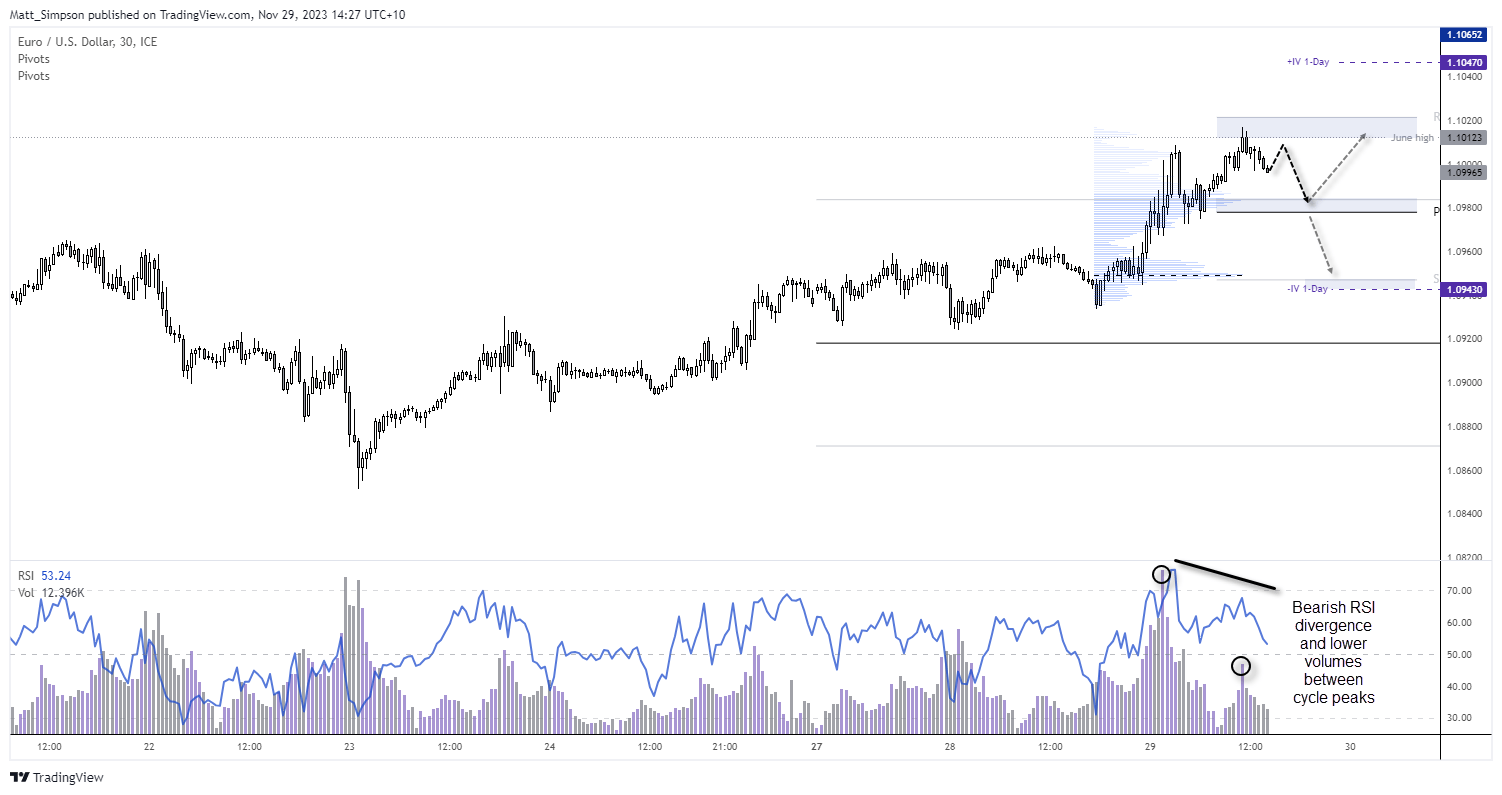
EUR/USD technical analysis (30-minute chart):
The euro rose to a 3-month high on Tuesday and tried to extend those gains in Wednesday’s Asian session. Yet it finds itself back below 1.10 during low volatility trade, while the RSI (2) is overbought on the daily timeframe.
The 30minute chart shows a bearish divergence have formed with RSI (14), and a 2bar bearish reversal formed around the June high, just beneath the daily R1 pivot. Given trading volumes were much lower during the latest move higher, I suspect a retracement is on the cards. Bears could seek to fade into minor rallies beneath the June high and seek some bearish mean reversion towards 1.0980 near the weekly R1 pivot and HVN (high-volume node).
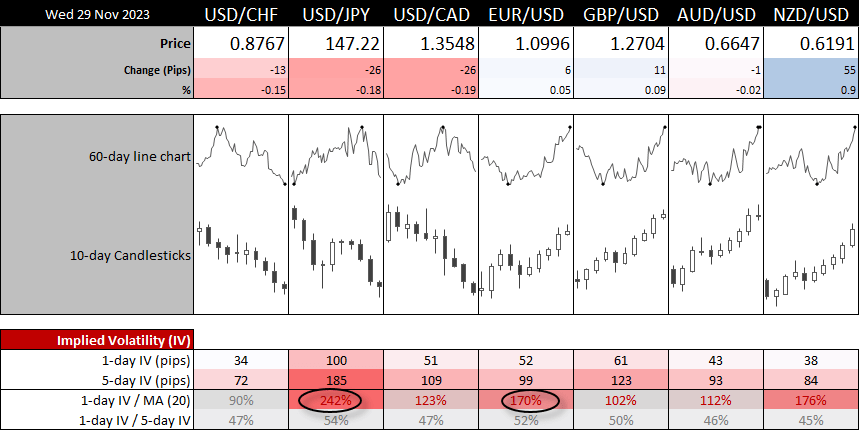
However, take note that the 1-day implied volatility band is 166% of its 20-day EMA, we could be looking for a much larger move today is economic data allows.
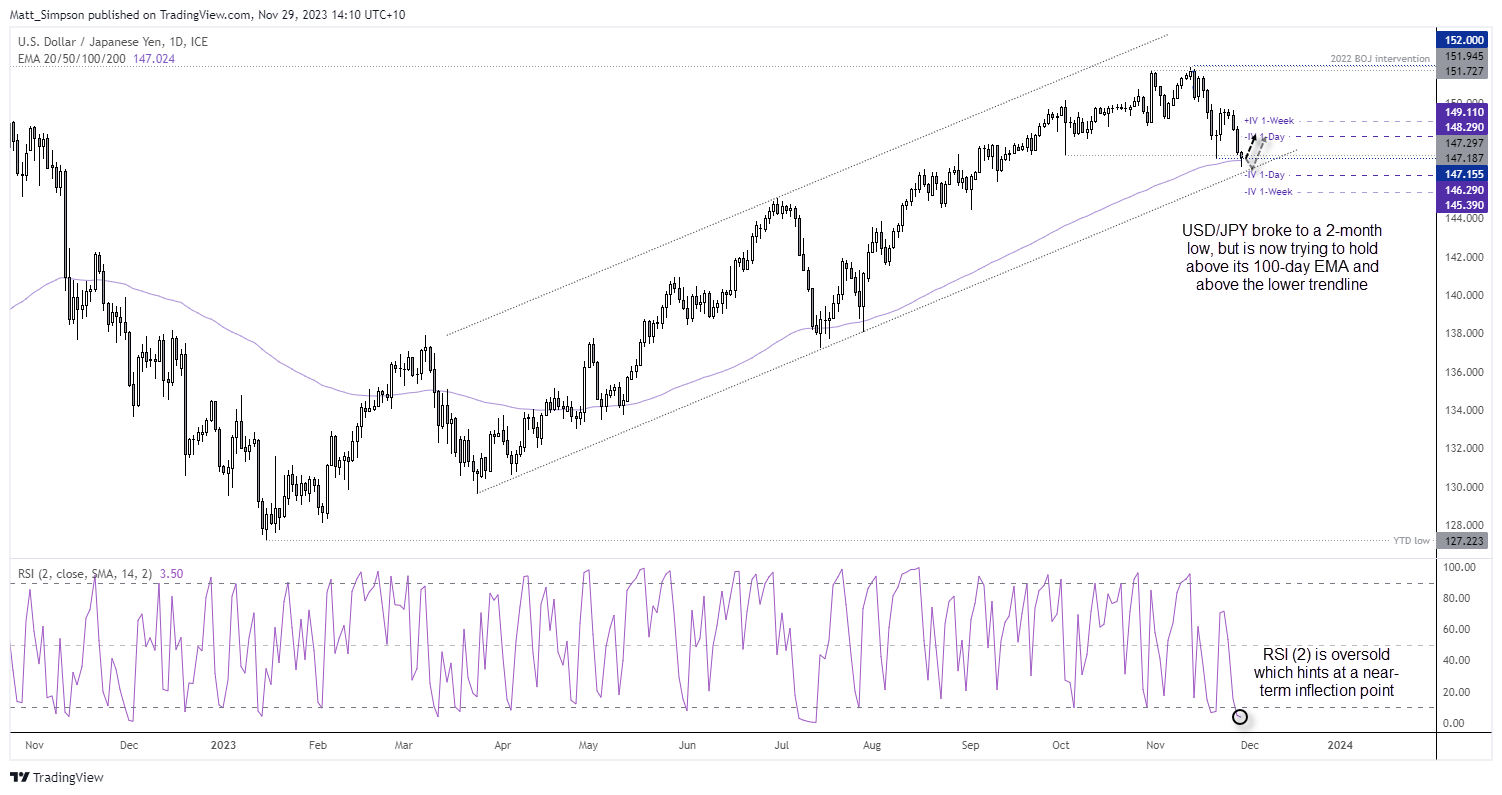
USD/JPY technical analysis (daily chart):
Over the past 12 days USD/JPY has fallen nearly -3.5%, although it is trying to find support around the 100-day EMA which is just above trend support. As I’m conscious that there has been a lot of excitement over the Fed cutting rates and a potential weak CPI report tomorrow, I’m also wondering whether US dollar weakness may be nearing an end over the near-term.
And as USD/JPY trades within a bullish channel, it almost seems inevitable that we’ll at least see a minor bounce.
Today’s early losses and break to a 2-month low have nearly been reversed, and prices are meandering around prior cycle low. The question to me now is whether we’ve already seen a cycle low, to if we’ll see another leg lower before dip buyers seek to enter close to trend support.
View the full economic calendar
-- Written by Matt Simpson
Follow Matt on Twitter @cLeverEdge
How to trade with City Index
You can trade with City Index by following these four easy steps:
-
Open an account, or log in if you’re already a customer
• Open an account in the UK
• Open an account in Australia
• Open an account in Singapore
- Search for the market you want to trade in our award-winning platform
- Choose your position and size, and your stop and limit levels
- Place the trade
Latest market news
Yesterday 01:32 PM
Yesterday 09:35 AM
Yesterday 07:23 AM
Yesterday 04:48 AM
Yesterday 12:17 AM
July 25, 2024 10:39 PM
Latest Trade Ideas articles

Yesterday 09:35 AM

Yesterday 12:17 AM

July 25, 2024 10:39 PM

July 25, 2024 05:30 PM