


Asian Indices:
- Australia's ASX 200 index rose by 33.8 points (0.48%) and currently trades at 7,069.10
- Japan's Nikkei 225 index has risen by 15.99 points (0.05%) and currently trades at 33,442.35
- Hong Kong's Hang Seng index has risen by 30.99 points (0.18%) and currently trades at 17,024.43
- China's A50 Index has risen by 57.19 points (0.49%) and currently trades at 11,749.19
UK and European indices:
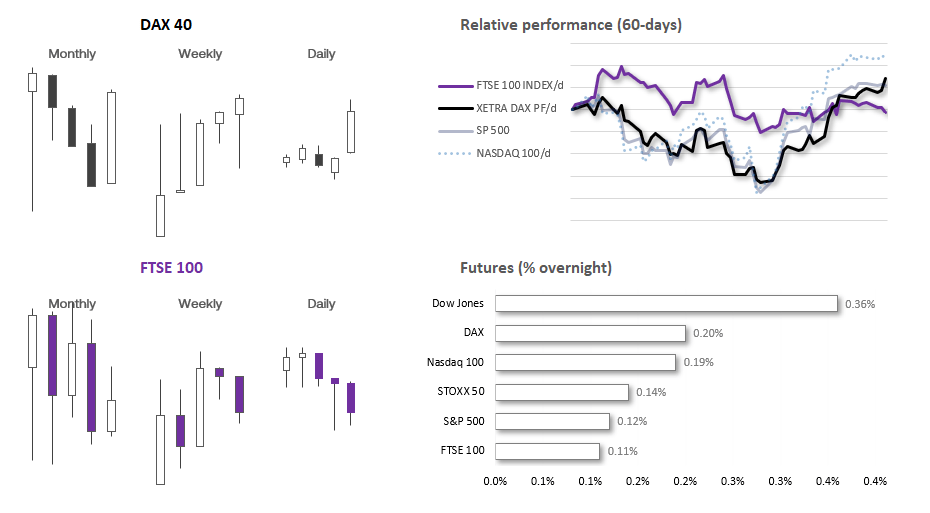
- UK's FTSE 100 futures are currently up 8.5 points (0.11%), the cash market is currently estimated to open at 7,431.96
- Euro STOXX 50 futures are currently up 6 points (0.14%), the cash market is currently estimated to open at 4,376.53
- Germany's DAX futures are currently up 33 points (0.2%), the cash market is currently estimated to open at 16,199.45
US index futures:
- DJI futures are currently up 128 points (0.36%)
- S&P 500 futures are currently up 5.5 points (0.12%)
- Nasdaq 100 futures are currently up 29.25 points (0.18%)
Events in focus (GMT):
- 07:00 – UK house price index
- 07:00 – German retail sales
- 07:45 – French PCI
- 08:55 – German unemployment
- 10:00 – Euro CPI
- 13:30 – US PCE inflation, personal income, personal spending, jobless claims
- 13:30 – Canadian GDP, average earnings
- 14:05 – FOMC member Williams speaks
- 14:45 – Chicago PMI
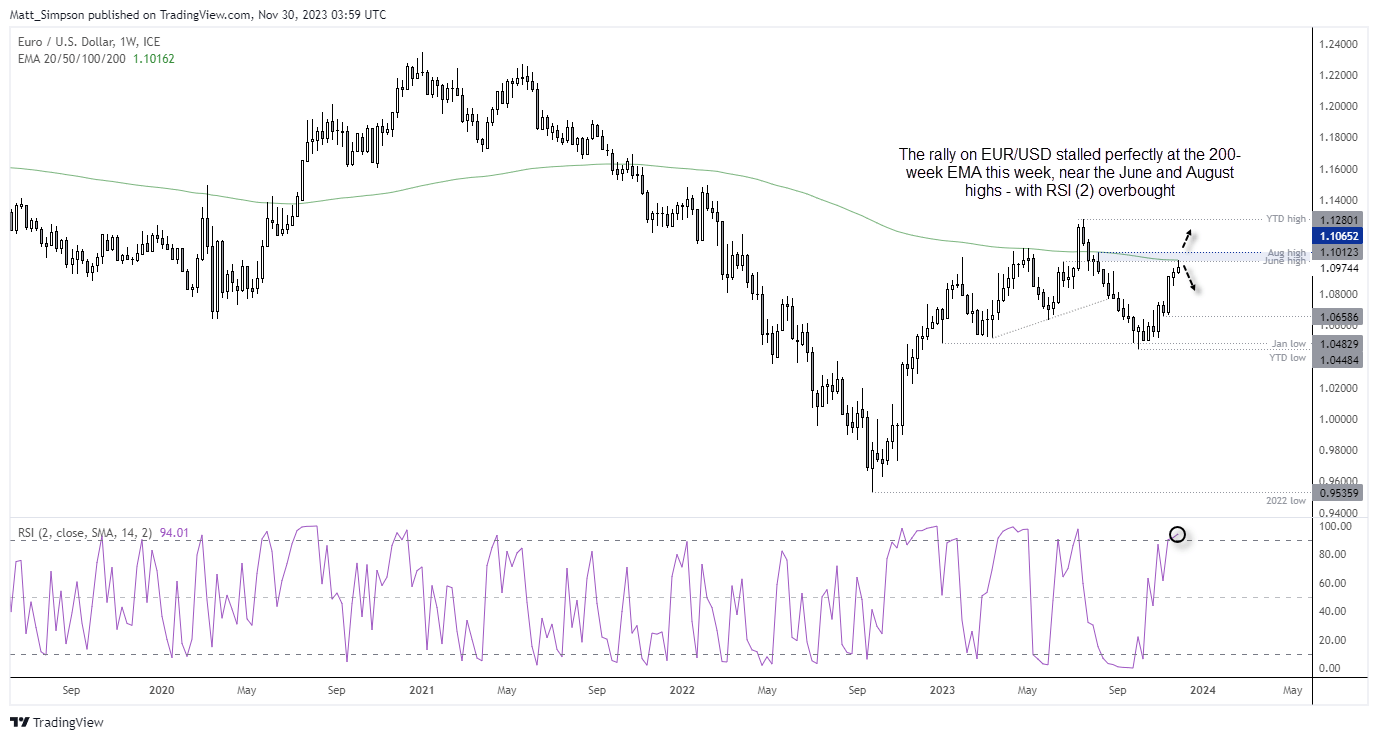
EUR/USD technical analysis (weekly chart):
The euro no doubt caught many bears offside during its 5.5% rally from the September low, but there are signs the move is running out of steam. Last week’s range was the smallish bullish candle during the rally, its upper and lower wick showed a hesitancy to travel in either direction with conviction, and RSI (2) reached overbought. Furthermore, this week’s high perfectly respected the 200-week EMA and we also have the June and August highs to content with.
I continue to suspect we’re at or near an inflection point given there has been little in the way of a pullback on the US dollar in general.
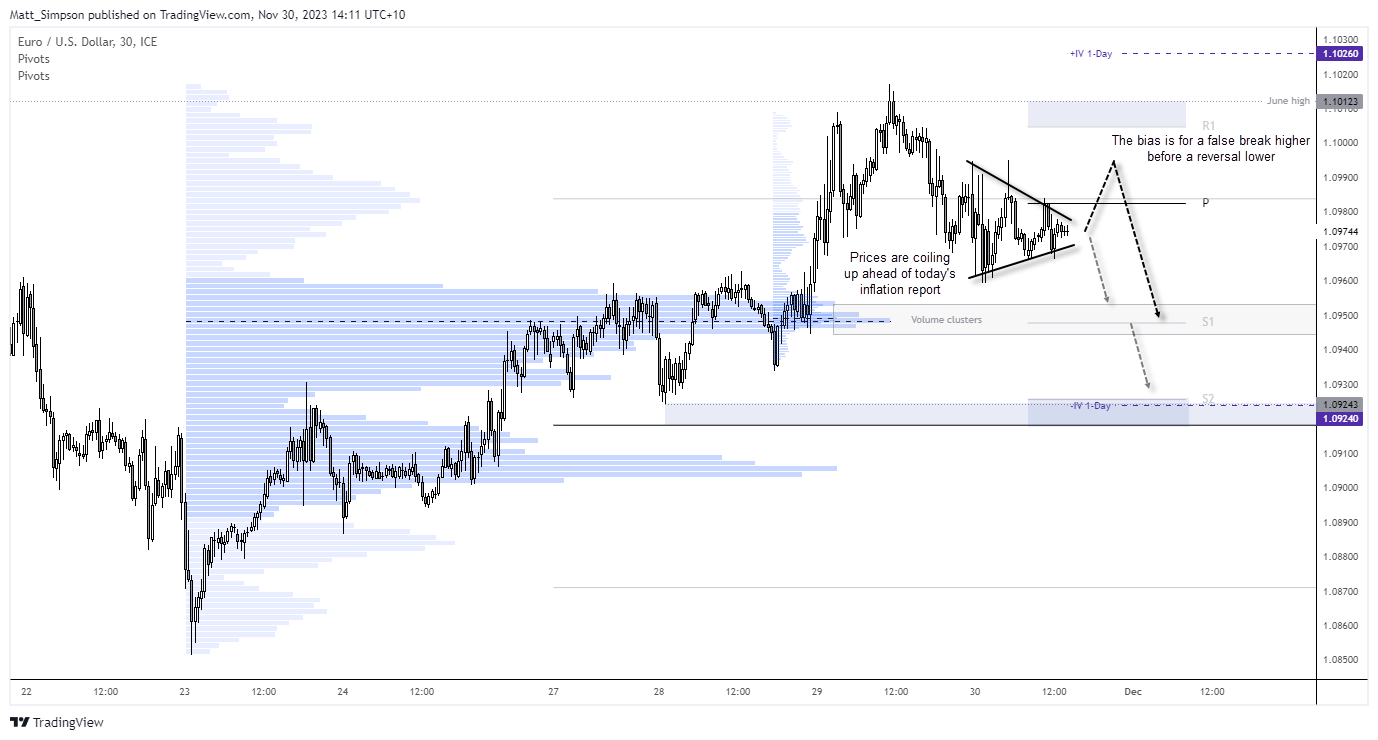
EUR/USD technical analysis (30-minute chart):
Prices are coiling up on the 30-minute chart, which can be indicative or a burst of volatility. A traditional theory assumes that the breakout tends to occur in the direction of the underlying trend. And whilst this may be true, it does not indicate how powerful any such breakout may be. However, given my observation that markets can move in the direction in harmony of the general sentiment of an upcoming event before reversing, I would not be surprised to see EUR/USD break higher ahead of today’s PCE report before falling over. Perhaps it may be a case of ‘buy the rumour, sell the fact’, or even that inflation data defies the consensus and sparks the more volatile move in the opposite direction. Hence the bias for an initial move higher before reversing lower.
Take note of the volume clusters around 1.0950 which may provide support. But if the volatility reaction is large enough, also note that the 1-day implied volatility level is around 1.0925.
View the full economic calendar
-- Written by Matt Simpson
Follow Matt on Twitter @cLeverEdge
How to trade with City Index
You can trade with City Index by following these four easy steps:
-
Open an account, or log in if you’re already a customer
• Open an account in the UK
• Open an account in Australia
• Open an account in Singapore
- Search for the market you want to trade in our award-winning platform
- Choose your position and size, and your stop and limit levels
- Place the trade
Latest market news
Yesterday 01:32 PM
Yesterday 09:35 AM
Yesterday 07:23 AM
Yesterday 04:48 AM
Yesterday 12:17 AM
July 25, 2024 10:39 PM
Latest Trade Ideas articles

Yesterday 09:35 AM

Yesterday 12:17 AM

July 25, 2024 10:39 PM

July 25, 2024 05:30 PM