


Asian Indices:
- Japan's Nikkei 225 index has risen by 85.78 points (0.27%) and currently trades at 32,350.95
- Hong Kong's Hang Seng index has fallen by -110.29 points (-0.57%) and currently trades at 19,279.66
- China's A50 Index has fallen by -21.41 points (-0.17%) and currently trades at 12,578.83
UK and Europe:
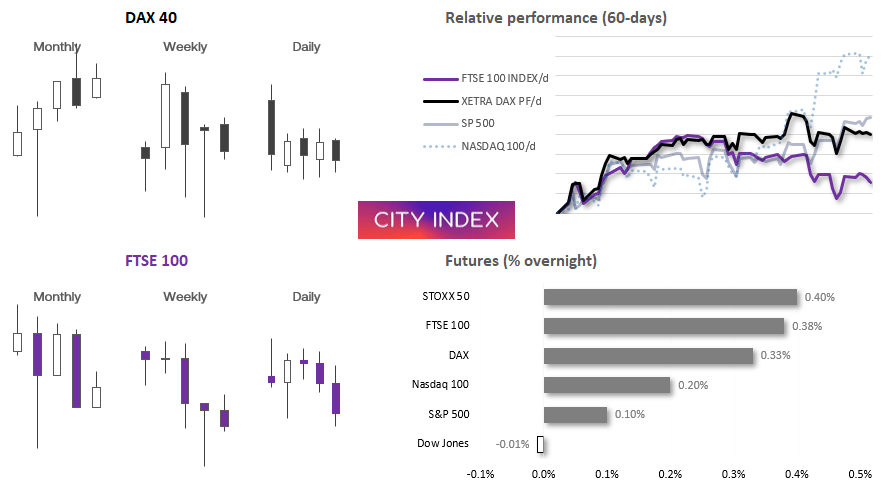
- UK's FTSE 100 futures are currently up 28.5 points (0.38%), the cash market is currently estimated to open at 7,590.86
- Euro STOXX 50 futures are currently up 16 points (0.37%), the cash market is currently estimated to open at 4,305.79
- Germany's DAX futures are currently up 53 points (0.33%), the cash market is currently estimated to open at 16,002.84
US Futures:
- DJI futures are currently down -11 points (-0.03%)
- S&P 500 futures are currently up 3.25 points (0.08%)
- Nasdaq 100 futures are currently up 24.75 points (0.17%)
- It has been a quiet start to the week, with Australia on a public holiday and little in the way of macroeconomic data
- Further signs of disinflation across Asia appeared with Japan’s producer prices contracting -0.7% m/m (-0.2% expected, 0.3% prior) and rising 5.1% y/y, beneath the 5.5% expected and 56.9% prior
- US indices continued to outperform European bourses, with the S&P 500 and Nasdaq 100 closing to a 9 month and 14-month high, respectively
- Bullish pinbars formed on the DAX and FTSE 100 two weeks ago, and both indices held above the top half of their respective pinbars last week to show demand picking up
- Yet the DAX remained confined within a tight range on the daily chart whilst the FTSE closed at a 5day low
- With key central bank meetings lined up including the Fed and ECB, there is a reasonable chance to expect volatility to remain suppressed unless a new macroeconomic catalyst arrives
DAX 1-hour chart:

The DAX has closed lower for three consecutive week, yet an intraday V-bottom formed on May 31st to help the index close that week with a distinct bullish pinbar week. Since then, volatility has been lower and prices have remained confined within tight ranges, which is nothing short of a nightmare for breakout traders. But with a series of well-defined support and resistance zones to play around, perhaps range-trading strategies are the way to go until we see a clear breakout. For now, we’d prefer to seek evidence of swing lows around last week’s low, or the 15,855 – 15,880 area (gap support and monthly pivot) with an interim target around 16,000, a break above which brings the gap resistance / monthly R1 pivot zone into focus. Yet any sigs of weakness around these highs might also be tempting for bears to fade into. And as we have an FOMC and ECB meeting pending, we’re doubtful we’ll see any sustainable breakouts occur unless a fresh macro catalyst arrives.
Events and themes in focus for today (times in GMT+1)
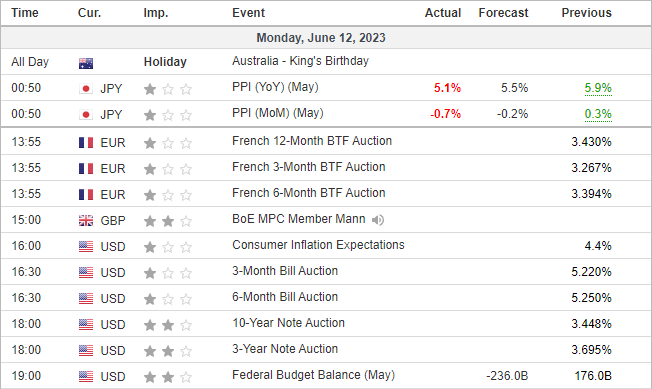
View the full economic calendar
-- Written by Matt Simpson
Follow Matt on Twitter @cLeverEdge
How to trade with City Index
You can trade with City Index by following these four easy steps:
-
Open an account, or log in if you’re already a customer
• Open an account in the UK
• Open an account in Australia
• Open an account in Singapore
- Search for the market you want to trade in our award-winning platform
- Choose your position and size, and your stop and limit levels
- Place the trade
Latest market news
Yesterday 01:32 PM
Yesterday 09:35 AM
Yesterday 07:23 AM
Yesterday 04:48 AM
Yesterday 12:17 AM
July 25, 2024 10:39 PM
Latest Dax articles

July 25, 2024 08:50 AM

July 17, 2024 08:26 AM
July 4, 2024 03:00 PM

July 3, 2024 08:27 AM