


November 30, 2022 3:04 AM

At the last Bank of Canada meeting, Committee members hiked rates by 50bps to bring the overnight rate to 3.75%. However, markets were expecting an increase of 75bps. Was this a BOC pivot? And although policy makers said that rates need to be raised further, it also said that it expects the Canadian economy to expand at 3.25% in 2022, but less than 1% in 2023. On Tuesday, Canada released its Q3 2022 GDP at 2.9% vs an expectation of only 1.5% and 3.2% in Q2. The GDP deflator dropped to -1.4% vs an expectation of 1.2% and a previous reading of 3.2%. Even better, to kick off Q4, Canada released its preliminary GDP for October. The print was 0% vs -0.3% expected and 0.1% in September.
Everything you wanted to know about the Bank of Canada
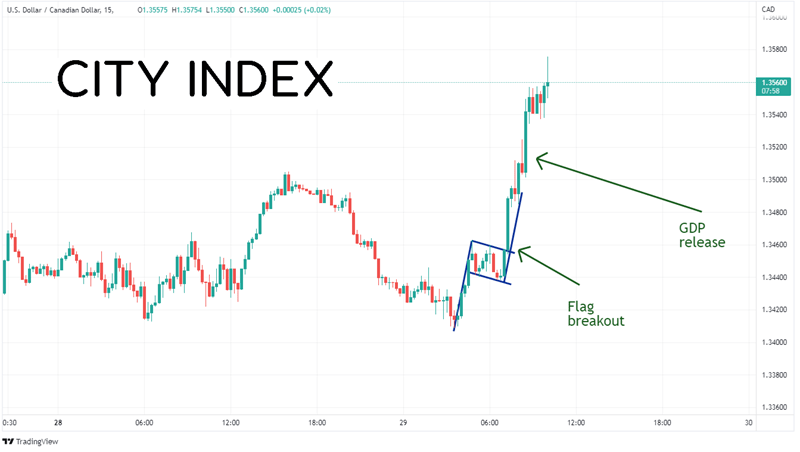
The short-term, 15-minute chart of USD/CAD acted a bit unusual today, both before and after the data. One and a half hours before the GDP data was released, USD/CAD broke above the top of a flag formation around 1.3457 and took off. It reached its flag target almost immediately near 1.3500. However, once the data was released, which should have been bullish for the Canadian Dollar, the pair resumed its move higher, reaching an intraday high of 1.3575.
Source: Tradingview, Stone X
Trade USD/CAD now: Login or Open a new account!
• Open an account in the UK
• Open an account in Australia
• Open an account in Singapore
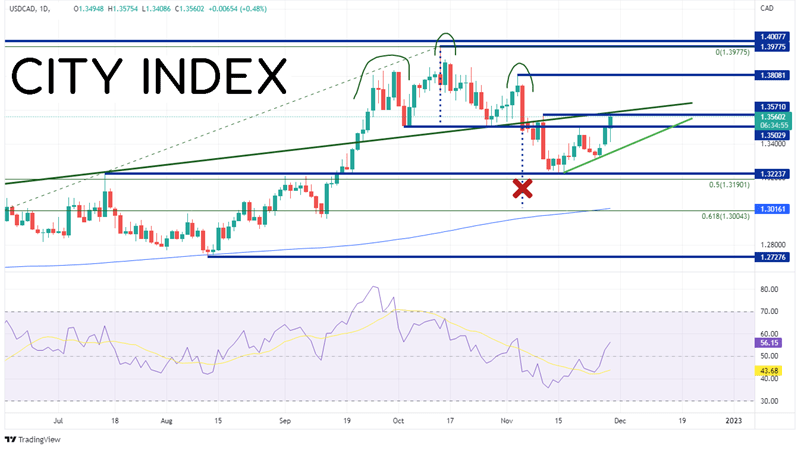
On a daily timeframe, USD/CAD had formed a Head and Shoulders pattern with a neckline near 1.3503. Price broke below the neckline on November 4th. Yet, it wasn’t until November 10th that USD/CAD moved aggressively lower towards the head and shoulders target of 1.3040. However, price held horizontal support at 1.3224 and began moving higher. With today’s move in price, up over 150 pips off the low, the head and shoulders pattern was negated as price traded back above the neckline. The pair in now up against a confluence of resistance at the highs of November 10th and a long-term rising trendline dating to March 7th at 1.3571.
Source: Tradingview, Stone X
If price continues to move higher, the next level of resistance is at the 50% retracement level from the highs of November 10th to the lows of November 15th at 1.3601 and then the 61.8% Fibonacci retracement level from the same timeframe near 1.3690. Above there is horizontal resistance from the highs of November 3rd at 1.3808. However, if the resistance holds, the first support level is back at the neckline of the head and shoulders pattern near 1.3503/1.3505. Below there, price can fall to Tuesday’s low at 1.3408, then the low from November 25th at 1.3317.
USD/CAD made a large move higher today, though it doesn’t seem like it was based on fundamentals. But there are several other upcoming events that traders could be looking ahead to. They include month-end, the OPEC+ meeting on Sunday (which could affect the direction of the Canadian Dollar), or even the Bank of Canada meeting next Wednesday. Whatever the reasoning, watch the support and resistance levels for areas where price may halt or even reverse.
Learn more about forex trading opportunities.
Latest market news
Yesterday 01:32 PM
Yesterday 09:35 AM
Yesterday 07:23 AM
Yesterday 04:48 AM
Yesterday 12:17 AM
July 25, 2024 10:39 PM
Latest Trade Ideas articles

Yesterday 09:35 AM

Yesterday 12:17 AM

July 25, 2024 10:39 PM

July 25, 2024 05:30 PM