


March 1, 2023 2:05 AM

Annualized Q4 GDP for Canada was much worse than expected, with a print of 0% vs an expectation of +1.5% and a Q3 reading of +2.3%. This was the lowest reading since Q2 2021. The GDP Price Deflator continued to fall, posting a print of -0.7% vs an expectation of -0.8% and a prior reading of -1.2%. However, the Canadian data wasn’t all that bad. The preliminary reading for January’s GDP was +0.3% vs and expectation of -0.1% and a December reading of -0.1%. Recall that the Bank of Canada announced that it would pause rate hikes as it assesses the cumulative effect of rate hikes on the economy. The BoC will be happy to see that the GDP Price Deflator is moving lower, suggesting that rate hikes are working. The Bank of Canada meets again on March 8th and as mentioned, expectations are that the BoC will pause and leave rates unchanged. However, the central bank did say that it would continue with its quantitative tightening program.
Everything you need to know about the Bank of Canada
The GDP data for Q4 is resulting in a weaker Canadian Dollar. Strong inflation readings out of Spain and France earlier today are giving a bid to the Euro. As a result, EUR/CAD is moving higher. The pair made a low on August 25th, 2022, at 1.2877, creating an inverse head and shoulders pattern. Price then moved aggressively higher, testing prior resistance during the month of January at 1.4661. The pair has since pulled back, holding support at 1.4235 and is currently trading near the 50 Day Moving Average at 1.4436.
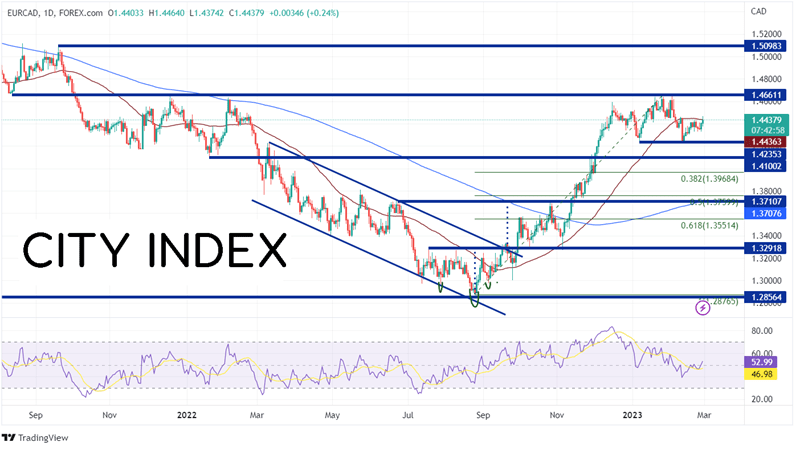
Source: Tradingview, Stone X
Trade EUR/CAD now: Login or Open a new account!
• Open an account in the UK
• Open an account in Australia
• Open an account in Singapore
Not only is EUR/CAD trading at the 50 Day Moving Average, but on a 240-minute chart it is also trading a previous resistance in a rising triangle. If price breaks above the triangle and Moving Average, the next resistance level isn’t until a confluence of the January highs and the prior resistance between 1.4627 and 1.4661. Above there price can move to the psychological round number resistance level of 1.5000, then the highs from September 2021 at 1.5098 (see daily). However, if EUR/CAD pulls back, the first support is at the upward sloping trendline from the triangle near 1.4334, then the lows from January 6th at 1.4235. If price breaks below there, the next support level is from early 2022 at 1.4100 (see daily).
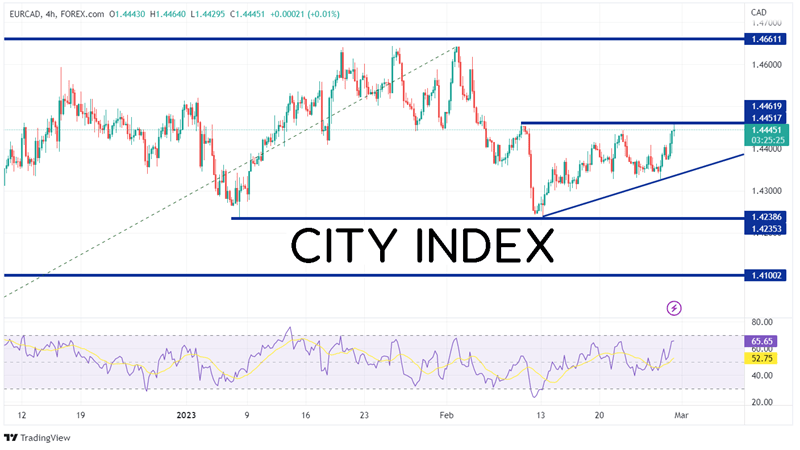
Source: Tradingview, Stone X
The Canadian GDP was much worse than expected, however the GDP Price Deflator was also weak, which lends credence to the Bank of Canada’s decision to pause rate hikes at the March meeting. However, the January preliminary GDP was stronger, giving hope to a soft landing in Canada. As a result of the strong European CPI earlier and the weaker price deflator from Canada, EUR/CAD has moved higher into resistance. If price breaks above the resistance, it has room to run.
Learn more about forex trading opportunities.
--- Written by Joe Perry, Senior Market Strategist
Follow me on Twitter at @JoeP_FOREXcom
Latest market news
Yesterday 01:32 PM
Yesterday 09:35 AM
Yesterday 07:23 AM
Yesterday 04:48 AM
Yesterday 12:17 AM
July 25, 2024 10:39 PM
Latest Trade Ideas articles

Yesterday 09:35 AM

Yesterday 12:17 AM

July 25, 2024 10:39 PM

July 25, 2024 05:30 PM