


February 2, 2023 3:09 AM

The ADP Employment Change showed that the US economy added 106,000 private sector jobs in January. Expectations were for 178,000 jobs to be added. This was the lowest print since January 2021! However, this print should be taken with a grain of salt as ADP noted that the extreme weather that hit much of the country effected that data. December’s print was revised higher from 235,000 to 253,000. Although there is no correlation between the ADP Employment Change and Non-Farm Payrolls, one must consider that weather may have impacted the January NFP as well, which will be released on Friday. Expectations are for a NFP print of +185,000 vs a December reading of +223,000. Traders will be paying just as much attention to the Average Hourly Earnings, which was revised lower in November from 0.6% to 0.4%. Decembers print was 0.3% vs an expectation of 0.4%. If the trend continues, January’s Average Hourly Earnings may be lower than the 0.3% expected. It should also be noted that the Q4 2022 Employment Cost Index fell from 1.2% to 1.0%. Will a lower increase in jobs and a lower increase in wages (up to this point) affect the language used in the FOMC statement?
Everything you wanted to know about the Federal Reserve
GBP/USD has been had been moving higher since making all-time lows on September 26th, 2022. The pair then moved higher in an ascending wedge formation. As GBP/USD reached the apex and a high of 1.2447 on December 15th, 2022, it broke lower to 1.1956. However, in early January, the pair could not break through the confluence of horizontal support, the psychological round number support at 1.2000, and the 50-Day and 200-Day Moving Averages. GBP/USD went back to test the recent highs and is trading within that range currently.
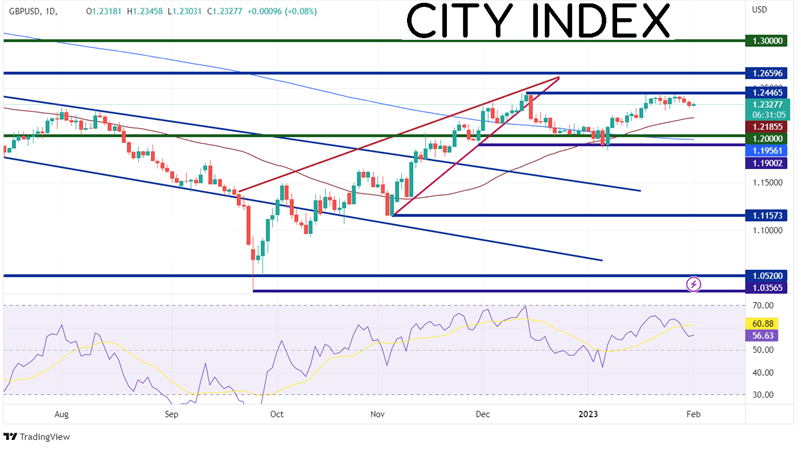
Source: Tradingview, Stone X
Trade GBP/USD now: Login or Open a new account!
• Open an account in the UK
• Open an account in Australia
• Open an account in Singapore
On a 240-minute timeframe, GBP/USD is trading just above horizontal support near 1.2300. If the Fed signals it still considers the jobs market to be strong and wages to be high (along with general inflation), GBP/USD should move lower. The next level of support is the low from January 24th at 1.2263. Below there, price can move to the 50 Day Moving Average at 1.2185 (see daily), then the lows from January 12th at 1.2084. However, if the Fed signals that its interest rate increases have worked and that it may pause in March, GBP/USD could move higher. The first level of resistance is the downward sloping trendline dating to January 23rd near 1.2410, then the highs from January 23rd at 1.2447. Above there, price can move to the highs of May 27th, 2022, at 1.2667.
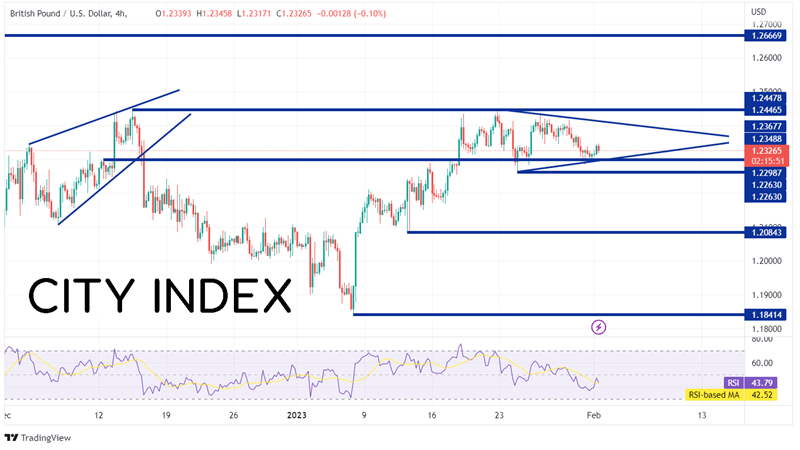
Source: Tradingview, Stone X
Will the weather effect from today’s ADP Employment Change have the same effect on January’s NFP report? And if it does, will the Fed and traders ignore it? The wage increase component will also be important. The Fed wants to see slowing wage increases, slowing job increases, and a higher Unemployment Rate to make sure interest rates are having the desired effect on inflation. Has that been shown over the last couple days and months in the jobs data? Watch the Fed’s statement and Fed Chairman Powell’s press conference to find out!
Learn more about forex trading opportunities.
Latest market news
Yesterday 01:32 PM
Yesterday 09:35 AM
Yesterday 07:23 AM
Yesterday 04:48 AM
Yesterday 12:17 AM
July 25, 2024 10:39 PM
Latest Trade Ideas articles

Yesterday 09:35 AM

Yesterday 12:17 AM

July 25, 2024 10:39 PM

July 25, 2024 05:30 PM