


Market summary
- Another day goes by without any progress on debt-ceiling talks, only this time equity traders (who are generally the most optimistic) are taking note
- Whilst Yellen has suggested June 1st as the cut off point for a deal (X-date), Goldman Sachs think it is actually June 8th. And this suggests both sides feel they have more time up their sleeves to drag negotiations out for longer – and as my colleague Greg Matjwetev pointed out – what is to stop Republicans ‘playing along’ with talks and simply walk out at the last minute to leave egg on Biden’s face?
- It would appear markets are now pricing in this risk with global equity markets were lower, futures markets for Europe continued lower after the cash market close and the S&P 500 and Nasdaq 100 fell to a 4-day low
- The US dollar was the strongest FX major as it took in safe-haven flows, pushing AUD/USD to its MTD low, and AUD/USD within 1-2 trading days of its YTD low
- Flash PMI data was mixed yesterday, with data from Australia and Japan exceeding expectations whilst UK data disappointed
- Today’s RBNZ meeting is the main scheduled economic event in today’s APAC session, although headlines surrounding debt ceiling negotiations (or lack of) could easily drive market sentiment today and overnight
APAC Economic events in focus (AEDT):
- 08:45 – NZ retail sales
- 12:00 – RBNZ cash rate decision (which has the potential for a hawkish hike)
- 13:00 – RBNZ post-meeting press conference
- 16:00 – UK inflation report
- 18:00 – German Ifo business climate report
AUD/USD daily chart:
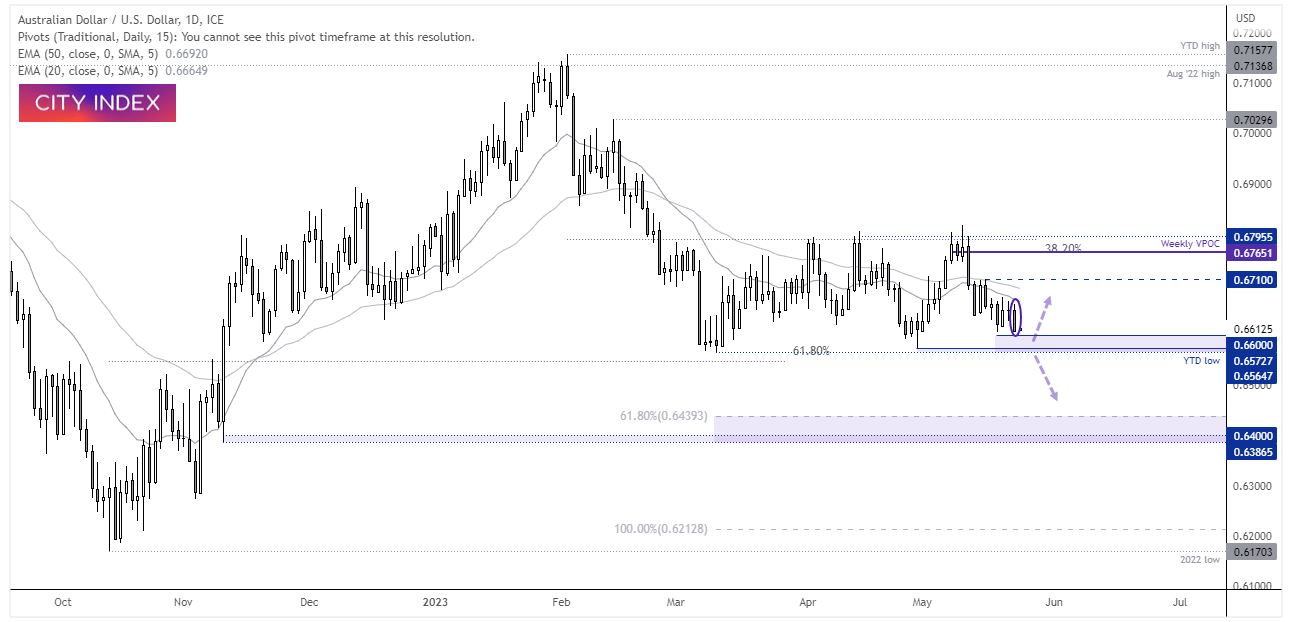
AUD/USD tested the MTD low and closed at the low of the day to show that bears meant business. The bearish candle also forms part of a 3-day bearish reversal pattern (Evening star) which respected the 20-day EMA as resistance. The question for bulls and bears alike is whether there is enough appetite to drive to this (and beneath) the current YTD low in march. We saw a strong rally from that level late April, although that has almost been unwound. So from here we will closely watch how prices reach within the 0.6560 – 0.6600 zone to see if it can form a base ahead of a potential really, or bearish volumes increase to indicate a downside breakout.
ASX 200 daily chart:
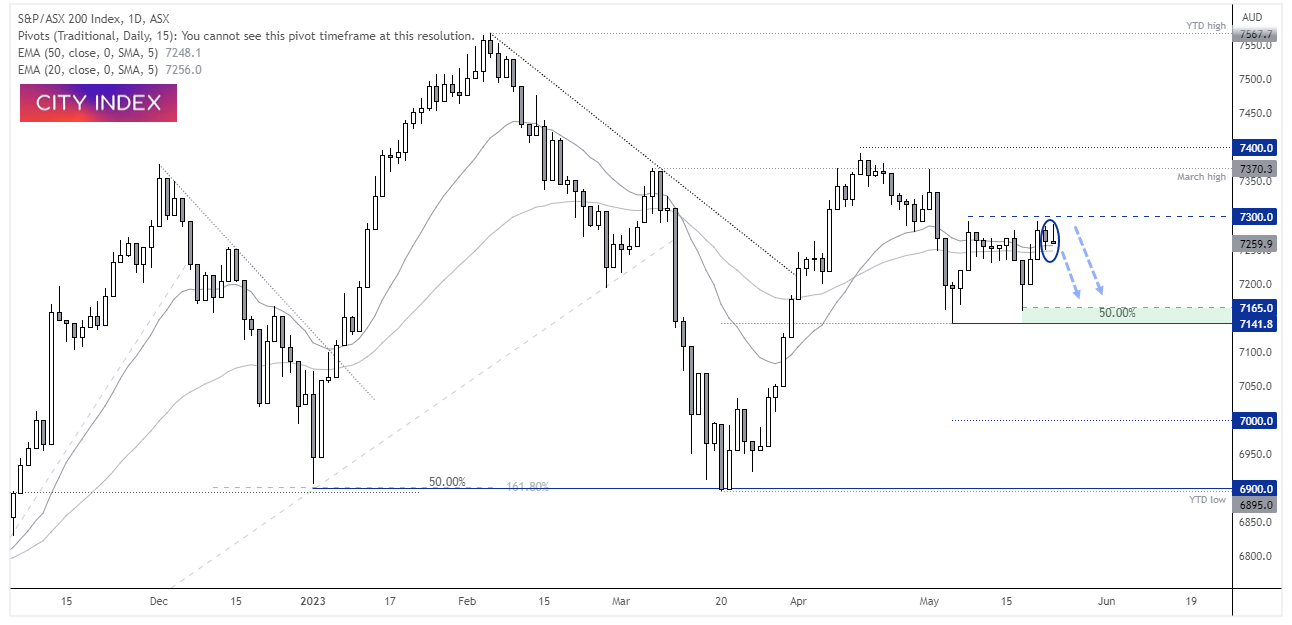
Monday’s bearish inside day was followed by a bearish Pinbar before sentiment turned lower, which shows strong resistance below 7300. It seems likely the cash market will open beneath the 20 and 50-day EMAs today, which makes the 7250 area a potential zone for bears to fade into, assuming it is tested at all. For now, the bias is for an initial move towards 7200, a break beneath which brings the 7142 – 7165 lows into focus.
-- Written by Matt Simpson
Follow Matt on Twitter @cLeverEdge
How to trade with City Index
You can trade with City Index by following these four easy steps:
-
Open an account, or log in if you’re already a customer
• Open an account in the UK
• Open an account in Australia
• Open an account in Singapore
- Search for the market you want to trade in our award-winning platform
- Choose your position and size, and your stop and limit levels
- Place the trade
Latest market news
Yesterday 01:32 PM
Yesterday 09:35 AM
Yesterday 07:23 AM
Yesterday 04:48 AM
Yesterday 12:17 AM
July 25, 2024 10:39 PM
Latest Trade Ideas articles

Yesterday 09:35 AM

Yesterday 12:17 AM

July 25, 2024 10:39 PM

July 25, 2024 05:30 PM