


Australian inflation figures for August 2023
- Weighted CPI rose 5.2% y/y as expected (4.9% previously)
- Headline CPI rose 0.8% m/m, or 5.5% y/y
- Automotive fuel rose 9.1% m/m, its fastest pace in 15 months (up 13.9% y/y)
- CPI less volatile items and holiday travel slowed for a fifth month to 5.5% y/y (5.8% prior)
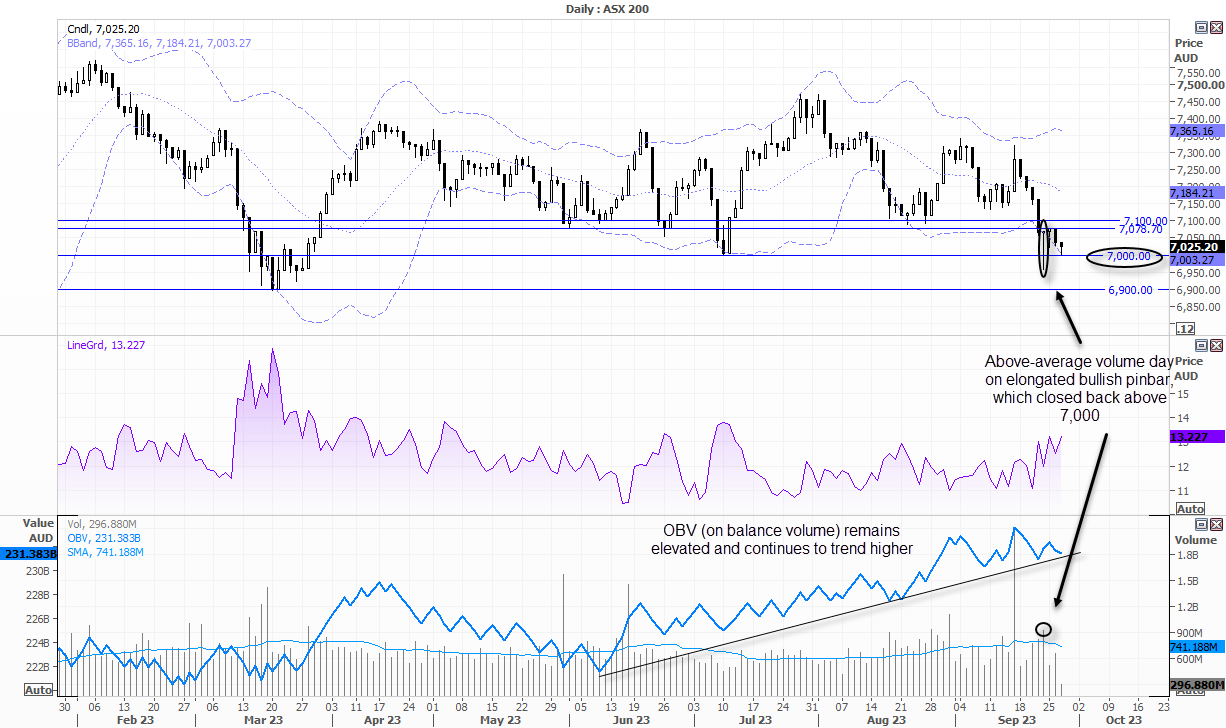
- Despite the negative sentiment, the ASX 200 is holding above a key level of support
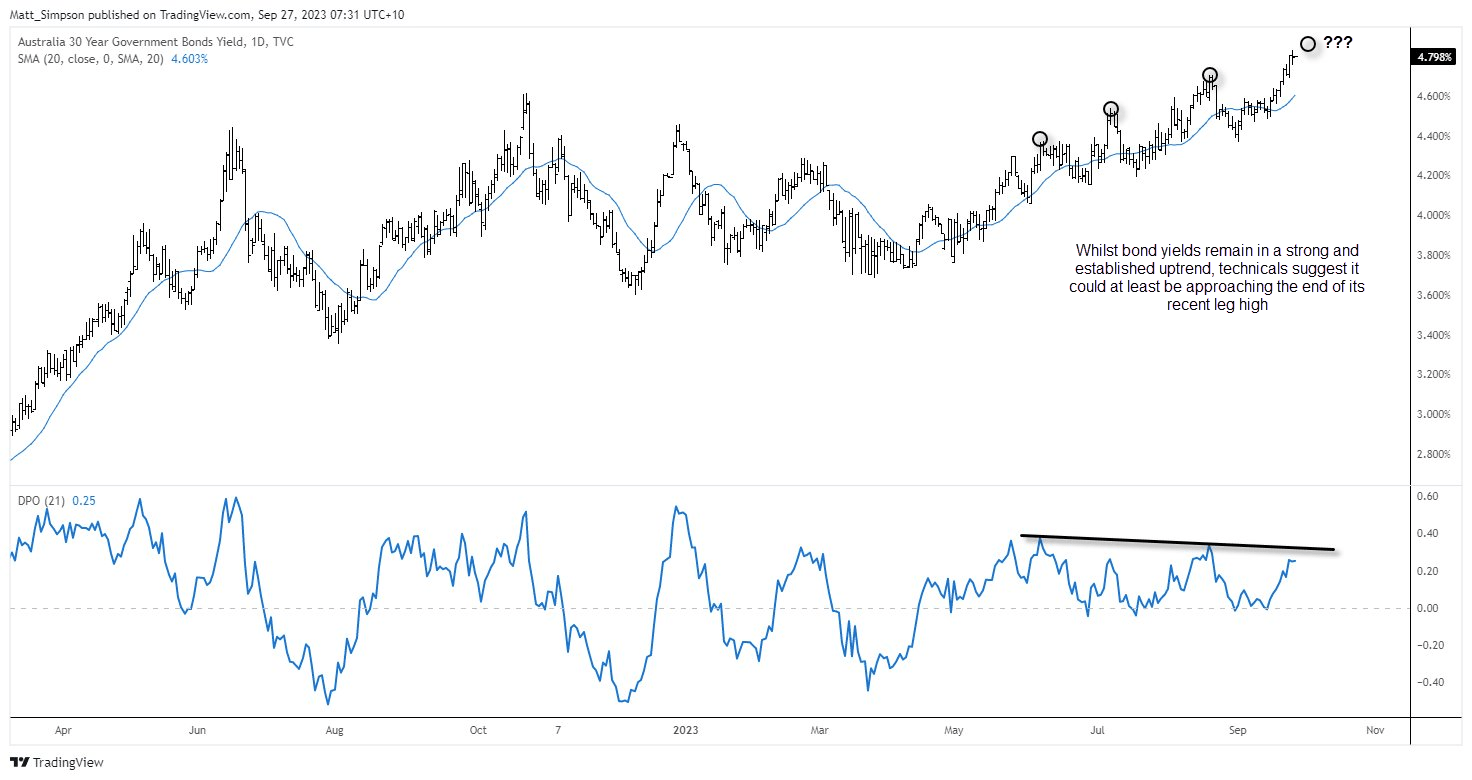
- Them overwhelming coverage of bond yields, alongside some basic technical has me wondering if yields are approaching a near-term peak
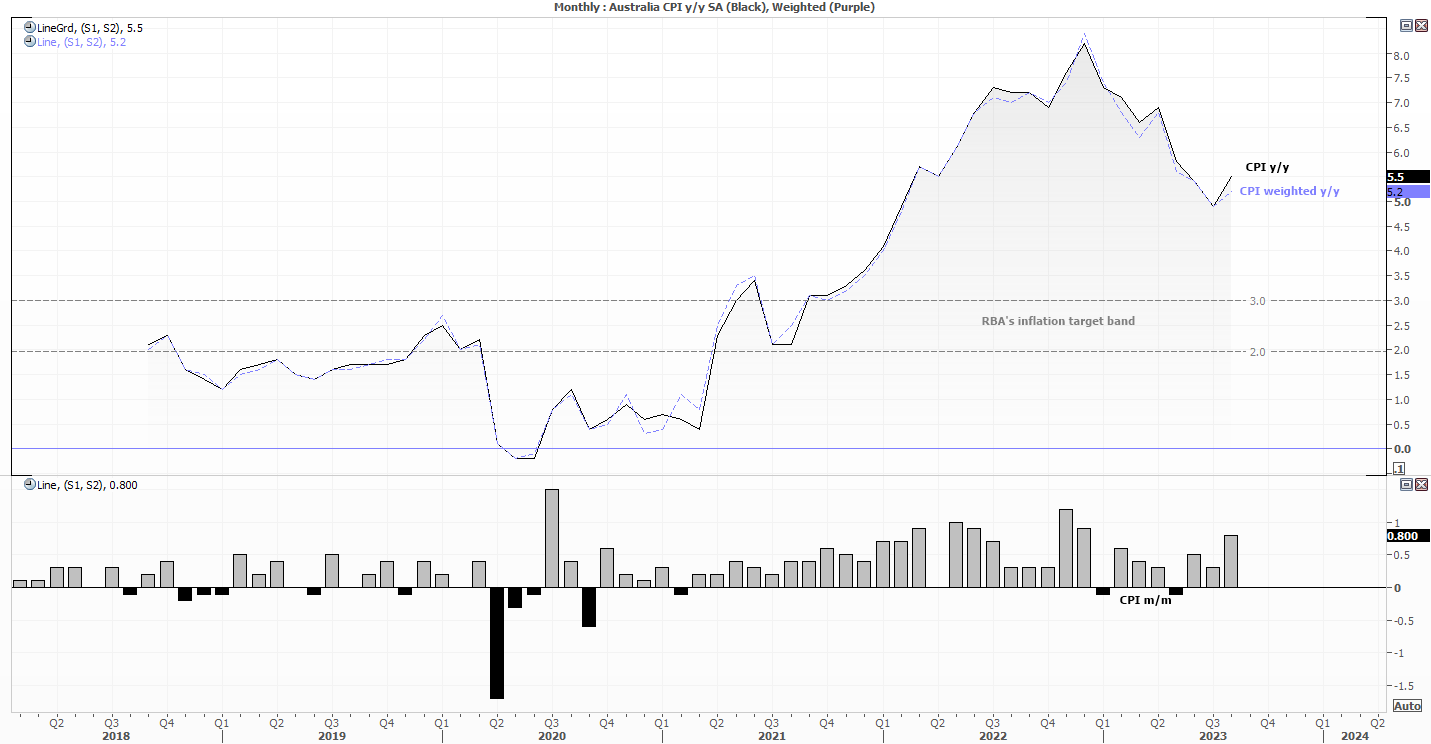
The annual rate of Australian inflation has finally copied the trend set by North America by curling higher, although with a peak set just eight months ago we cannot lay blame with the basing effect. Fuel costs rose over 9% in August, and judging from my local pumps we can expect fuel prices to further support the headline figure in next month’s report. And if that trend persists then it is another reason to expect consumer to cut back further on discretionary spending.
The weighed mean rose in line with market expectations of 5.2% y/y, but it is encouraging to see CPI less volatile items and holiday travel continue to soften to 5.5% y/y (5.8% prior).
Ultimately, today’s report likely does little to move the dial for the RBA in my view, who I expect to hold rates at 4.1% over the coming meetings. Besides, bond market rout and their rising yields have taken the centre stage, and sentiment remains at their mercy.
Bond yields continue to drive sentiment
And whilst rising yields has seen odds of another RBA hike rise slightly, if yields keep rising at their current rate then surely something will break. And then that is an entirely different situation for the RBA to mull over, and a case builds for cuts.
On that note, perhaps we’re approaching the end of the current cycle higher on bond yields. The chart displays the Australian 30-year yield, but is applicable to the US and shorter long-duration yields. At 4.8%, the 30-year is extended above its 20-day average so a case for a pause (if not a pullback) could be building. Whether that means a trend reversal could be wishful thinking, but the amount of headlines that bonds are generating at present, I am seriously wondering if the rise in yields have outdone themselves over the near-term. If so, it could throw a level of support under risk assets, although it is debatable as to whether it could trigger a risk-on rally.
ASX 200 technical analysis (daily chart)
Having taken a good look at the ASX 200 daily chart, I am seriously wondering if it has the legs to break convincingly below 7,000 immediately. There’s an overwhelming sentiment on my social media feeds that it will (or ‘should’), and perhaps they will turn out to be correct. However, a few things stood out which made me question the timing of its next leg lower.
The ASX 200 saw a strong 4-day decline, ahead of an elongated bullish pinbar which failed to hold below 7,000. That pinbar was also a high-volume candle, which can suggest a ‘change in hands’ between bears to bulls. A subsequent bullish pinbar occurred the following day and the market is yet to break beneath 7,000 since that large pinbar. Furthermore, the OBV indicator (on balance volume) remains elevated relative to prices, which means it has not confirmed the recent leg lower.
Admittedly, we’re not seeing strong volumes around these lows to suggest buyers are now wading in. But then neither are bears. And if yields can stop rising for a day or two, perhaps there’s a small case building for a bounce from the big 7k level.
If sentiment can stabilise, bulls may be seeking to buy dips around the 7,000 level with small targets to resistance levels such as 7100, 7200 etc. At which point, bears may try to reload and drive the market lower. A decisive break (or daily close) beneath 7,000 assumes a nasty run for 6,900.
-- Written by Matt Simpson
Follow Matt on Twitter @cLeverEdge
How to trade with City Index
You can trade with City Index by following these four easy steps:
-
Open an account, or log in if you’re already a customer
• Open an account in the UK
• Open an account in Australia
• Open an account in Singapore
- Search for the market you want to trade in our award-winning platform
- Choose your position and size, and your stop and limit levels
- Place the trade
Latest market news
Yesterday 01:32 PM
Yesterday 09:35 AM
Yesterday 07:23 AM
Yesterday 04:48 AM
Yesterday 12:17 AM
July 25, 2024 10:39 PM
Latest Trade Ideas articles

Yesterday 09:35 AM

Yesterday 12:17 AM

July 25, 2024 10:39 PM

July 25, 2024 05:30 PM