


Wednesday US cash market close:
- The Dow Jones Industrial fell -144.67 points (-0.42%) to close at 34,496.51
- The S&P 500 index rose -43.97 points (2.51%) to close at 34,058.75
- The Nasdaq 100 index fell -321.754 points (-2.17%) to close at 14,498.89
Asian futures:
- Australia's ASX 200 futures are down -21 points (-0.28%), the cash market is currently estimated to open at 7,469.10
- Japan's Nikkei 225 futures are down -360 points (-1.31%), the cash market is currently estimated to open at 26,990.30
- Hong Kong's Hang Seng futures are down -102 points (-0.46%), the cash market is currently estimated to open at 21,978.52
- China's A50 Index futures are down -53 points (-0.38%), the cash market is currently estimated to open at 13,915.18
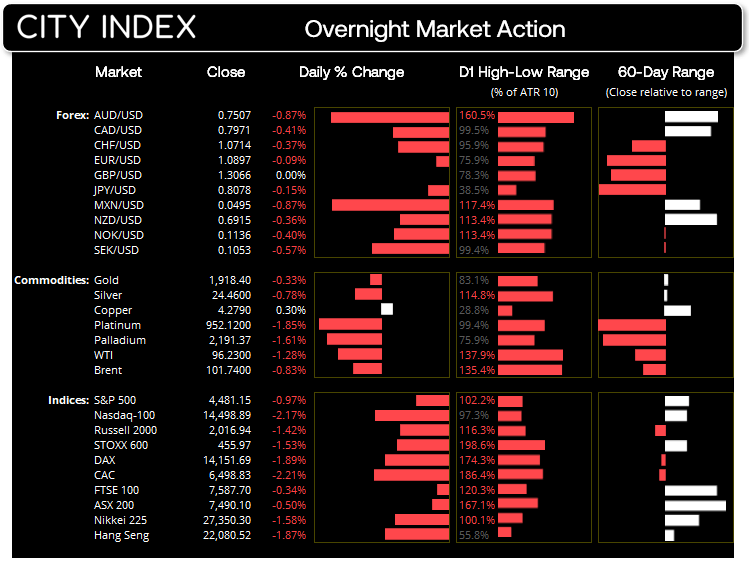
Wall Street was lower again overnight as the FOMC reinforced the view that an aggressive trajectory of rate hikes and balance sheet reduction is coming, starting at their next meeting. US equities were already under pressure the day prior following hawkish remarks from Daly and Brainard, but the minutes pushed the S&P 500 down to a 12-day low and test its 50-day eMA. 56% of its stocks declined, and 6 of its 11 sectors were in the red, led by consumer discretionary. Recovering to 4481, it has (for now at least) found support at the 50 and 20-day eMA.
ASX 200:
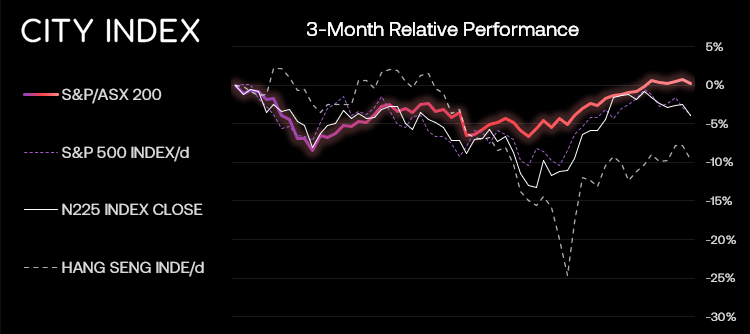
The ASX 200 is expected to come under further pressure today. Yesterday was its most bearish session in three weeks and closed with a hanging man candle. Yet due to the strength of its rally into the 7500 area we suspect we’re now in a period of choppy trade, and whilst we see the potential for a pullback, would prefer to step aside and seek bullish setups at lower prices.
ASX 200: 7490.1 (-0.50%), 06 April 2022
- Financial (0.7%) was the strongest sector and Info Tech (-2.88%) was the weakest
- 2 out of the 11 sectors closed higher
- 9 out of the 11 sectors closed lower
- 6 out of the 11 sectors outperformed the index
- 59 (29.50%) stocks advanced, 127 (63.50%) stocks declined
Outperformers:
- +6.92% - New Hope Corporation Ltd (NHC.AX)
- +5.53% - Whitehaven Coal Ltd (WHC.AX)
- +4.78% - Yancoal Australia Ltd (YAL.AX)
Underperformers:
- -6.89% - Novonix Ltd (NVX.AX)
- -6.88% - Block Inc (SQ2.AX)
- -6.53% - AVZ Minerals Ltd (AVZ.AX)
Demand and oversupply concerns weigh on oil
Energy prices were lower on concerns that the latest surge in covid cases in China would dent demand for oil, and that IEA (International Energy Agency) would release more oil from stockpiles. WTI fell to a 14-day low of 95.73 to closed beneath last week’s low. Natural gas left an ominous reversal candle just beneath its record high on the daily chart.
How to start oil trading
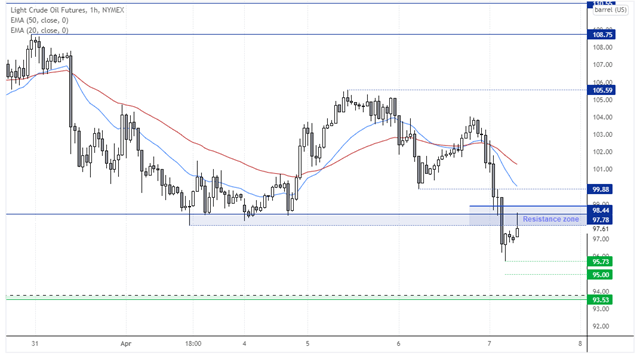
We can see on the hourly chart that WTI fell through 97.78 support, although prices have since pulled bac into a cluster of resistance levels around 98. The hourly candle is yet to close but it would be good to see a bearish hammer on this timeframe, or collection of reversal candles that close beneath the upper bounds of the zone to hint at a swing high. If satisfied that a lower high has formed, we’d then seek bearish setups to initially target 96, 95 and potentially 94, just above this thin support zone.
US dollar hits a near 2-year high
The hawkish FOMC minutes saw the US dollar index hit a 23-month high overnight, although its rally stopped just shy of 100. The day’s range was also its lowest of its 5-day rally so there is clearly some hesitancy to push immediately higher.
USD/CAD mean reverts
Commodity currencies were dragged lower by the selloff seen across energy markets, with AUD and CAD leading the way south. In fact the Canadian dollar looked past its solid PMI report, which touched a record high with stronger employment, although this did work out well for our hunch that USD/CAD was due to mean revert. We’ve seen a clear break of Tuesday’s bullish pinbar and rally to a 7-day high, although resistance from the 20-day eMA and weekly R1 pivot sit around 1.2573
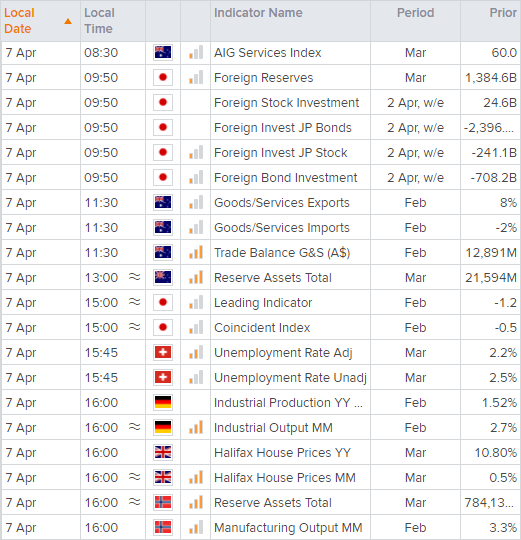
Up Next (Times in AEST)
How to trade with City Index
You can easily trade with City Index by using these four easy steps:
- Open an account, or log in if you’re already a customer
- Search for the company you want to trade in our award-winning platform
- Choose your position and size, and your stop and limit levels
- Place the trade
Latest market news
Yesterday 01:32 PM
Yesterday 09:35 AM
Yesterday 07:23 AM
Yesterday 04:48 AM
Yesterday 12:17 AM
July 25, 2024 10:39 PM
Latest Trade Ideas articles

Yesterday 09:35 AM

Yesterday 12:17 AM

July 25, 2024 10:39 PM

July 25, 2024 05:30 PM