
Gold looks to US inflation
Gold has been advancing in recent sessions on US Dollar weakness and as treasury yields dropped. However, today both yields and the greenback are rising on inflation fears, after Chinese CPI & PPI jumped, pulling dollar denominated gold lower off a two month.
US PPI came in at 8.6% YoY and 0.6% MoM, roughly in line with forecasts. However, with PPI so high, its hard to see CPI falling significantly as business can either absorb the higher costs or pass them on to customers.
CPI could provide clues over the timing of the next rate hike. CPI is expected at 5.3%YoY in October down from 5.4%. Core CPI is expected to hold steady at 4%.
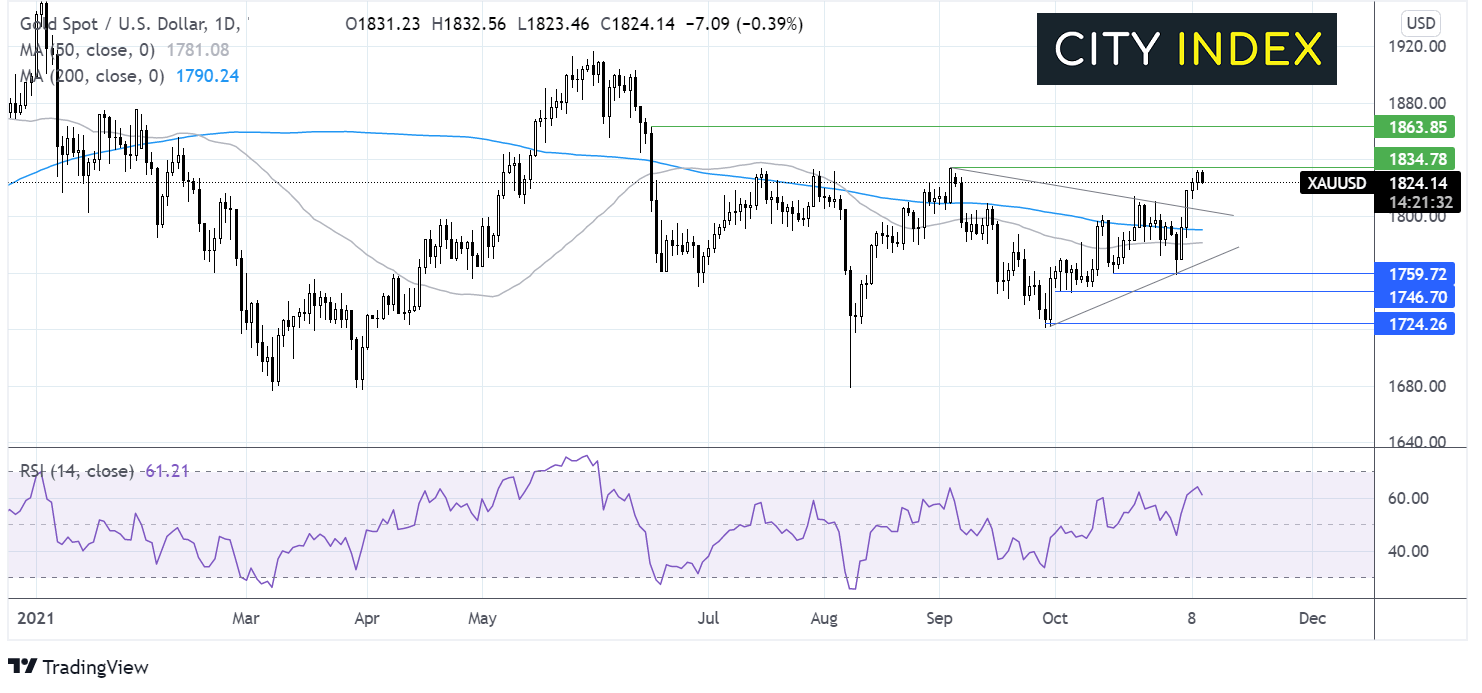
Where next for gold prices?
A break out a symmetrical triangle in addition to the RSI sitting in bullish territory is keeping the buyers optimistic of further gains.
Buyers need a close over 1335the September high to cement further upside towards 1863.
Meanwhile a fall below 1803 the upper band of the triangle could expose the 200 sma at 1792. It would take a move below 1771 the lower band of the triangle for sellers to gain traction.
AUD/USD tests 50 sma after Chinese inflation, real estate concerns
AUD/USD falls lower after Chinese inflation surged and amid growing concerns over the health of the indebted Chinese real estate sector.
Chinse whole sales inflation, PPI jumped to a 26 year high at 13.5% yoy up from 10.7%. Chinese CPI also riose to 1.5% YoY, ahead of forecasts of 1.4%.
Chinese authorities have taken steps in recent months, particularly in the commodities markets to cool inflation, however there are few signs of this being reflected in data yet.
Fantasia Holdings a Chinese real estate firm traded 50% lower after failing to make a coupon payment last month. This comes after Evergrande also teetered on the brink of collapse.
US CPI data is due later.
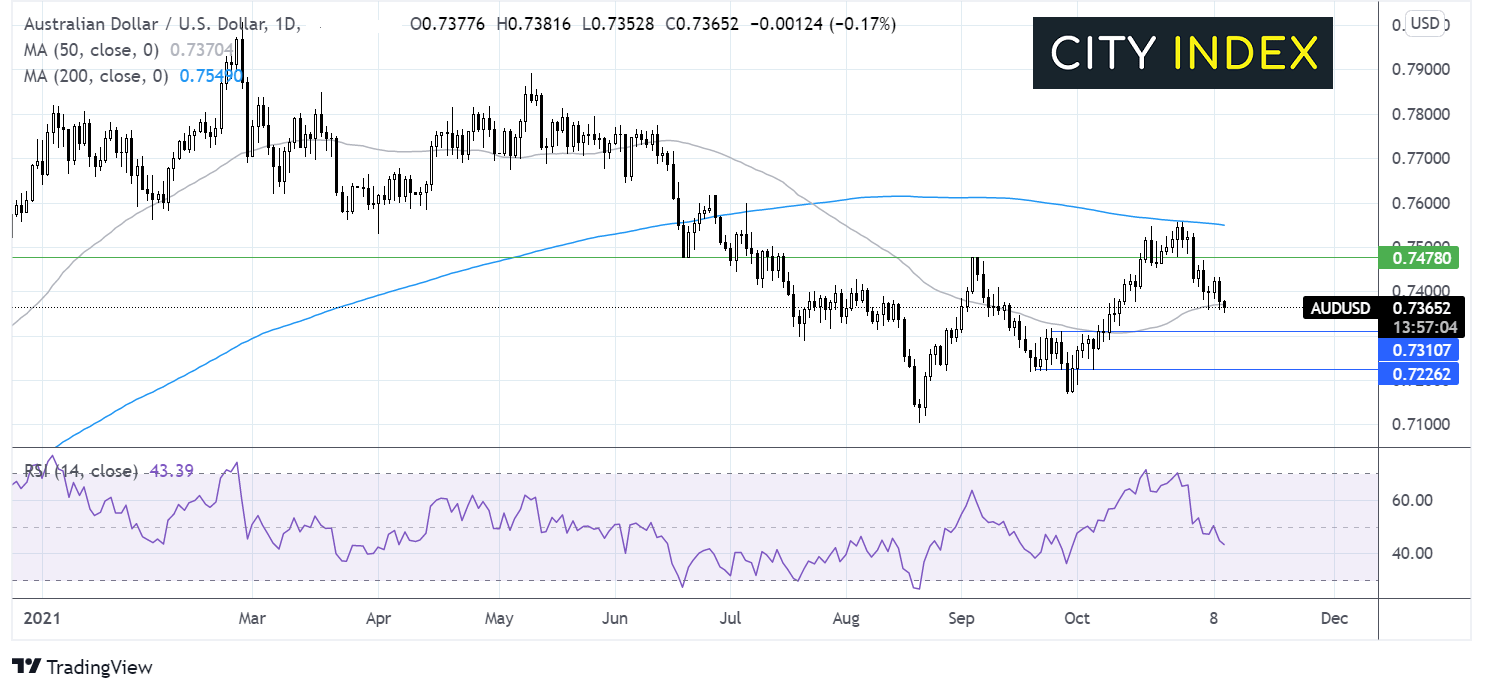
Where next for AU/USD?
AUD/USD faced rejection at the 200 sma, breaking below 0.7475 support and is currently testing the 50 sma at 0.7360.
The RSI has tipped into bearish territory suggesting further losses could be on the cards.
Support can be seen at 0.7315 the late September high opening the door to 0.73 round number and 0.7225 the October 6 swing low.
Should the 50 sma hold a rebound towards 0.74 round number and 0.7480 the September high could be on the cards.
How to trade with City Index
Follow these easy steps to start trading with City Index today:
- Open a City Index account, or log-in if you’re already a customer.
- Search for the market you want to trade in our award-winning platform.
- Choose your position and size, and your stop and limit levels
- Place the trade.
Latest market news
Yesterday 01:32 PM
Yesterday 09:35 AM
Yesterday 07:23 AM
Yesterday 04:48 AM
Yesterday 12:17 AM
July 25, 2024 10:39 PM
Latest Commodities articles

July 22, 2024 02:47 AM

July 18, 2024 12:48 AM

July 15, 2024 01:00 AM

July 13, 2024 12:00 PM