

Japanese Yen Talking Points:
- Yen-weakness has been prominent so far in early-2024 trade.
- Yen-strength became more prominent in Q4 as expectations began to build for rate cuts elsewhere, such as the US or Europe, which helped to prod pullbacks in both USD/JPY and EUR/JPY. But with question marks around when those cuts may begin, there’s been strong pullback themes showing in each market as rate cut bets, particularly the timing, come into question.
- All three of USD/JPY, EUR/JPY and GBP/JPY have had recent interactions with their 200-day moving averages, and this can help to highlight which pair has been more responsive to Yen-strength and which have been driven more by Yen-weakness.
- I’ll be discussing these themes in-depth in the weekly webinar on Tuesday. It’s free for all to register: Click here to register.

With Yen-weakness showing up in early-2024 trade, I’ve seen the question multiple times: “Is the carry trade coming back?”
This is a difficult question to answer accurately as the rollover on those pairs remains biased towards the long side in USD/JPY, EUR/JPY and GBP/JPY. So, as far as motive, that’s been there all along. But it takes more than positive rate differentials to drive a carry trade as that also must be coupled with bullish price behavior from the market, which is what helps to make the scenario so attractive as we saw in 2021 and the first nine months of 2022 in USD/JPY.
The larger question is whether others in the market will agree on carry potential as denominated by that rate differential, enough to drive greater demand that could allow for bullish price movements to continue, and this is where some projections around future rate policy begin to enter the equation.
But perhaps better than espousing theory, we can investigate fact, and look at what happened in a similar prior instance to get an idea for what we can look for here. There was a very similar scenario in USD/JPY in Q4 of 2022, which held through the first couple weeks of last year from which we can draw some ideas.
When US CPI was released in November of 2022, USD/JPY had already started to show tendencies of a top as helped by an intervention from the Bank of Japan a month earlier. That took place around the 152.00 handle and that stalled bulls long enough for prices to begin pulling back. But 145 had held well as support during that pullback and it wasn’t until the release of that inflation data that bears got the motivation to make a run, and the move priced in aggressively after that.
In that same scenario the carry had remained positive but what had shifted was expectations around the USD. As CPI came in below-expectations and as the Fed had shared that they thought inflation was coming under control, expectations began to build that the FOMC would grow less and less hawkish and, eventually, begin to cut rates. It mattered little that any possible rate cuts would be somewhat far away; it was the anticipation of change that caused bulls to think twice, and that carry trade went aggressively into a pattern of unwind.
That pullback lasted for three months, and it wiped away 50% of the move that had taken 21 months to build. Support began to show up in early-2023 trade and USD/JPY then spent the next ten months trending higher until, eventually, price was at the same 152 level that had set the high the year before.
USD/JPY Weekly Price Chart
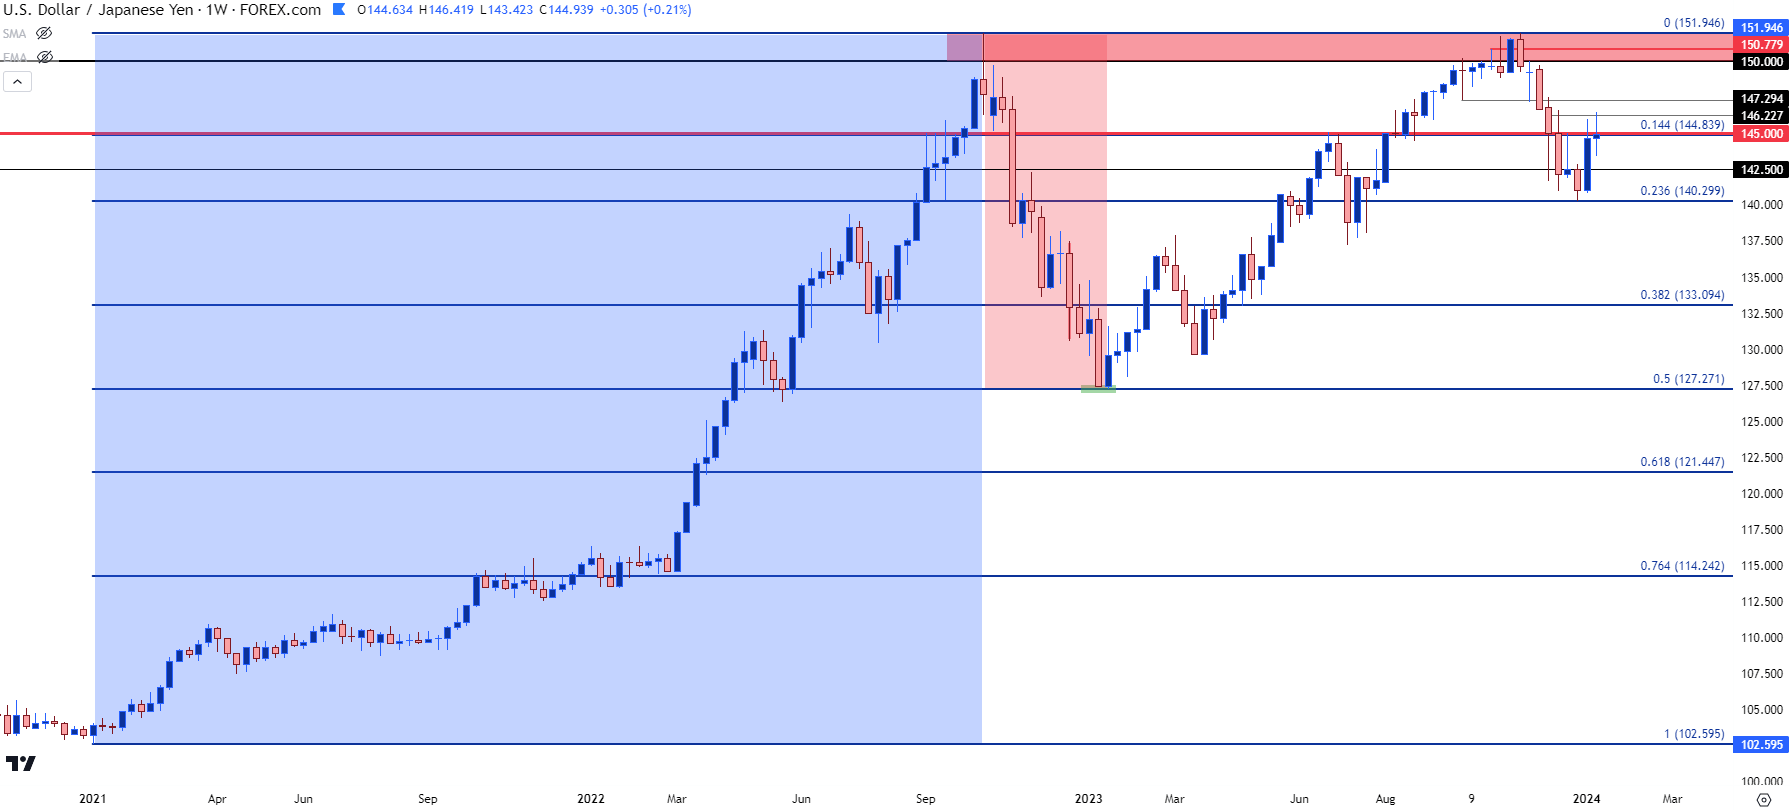 Chart prepared by James Stanley, USD/JPY on Tradingview
No rate cuts happened out of the US in 2023, obviously, but there was greater progress on inflation, further giving hope that the FOMC may be able to cut rates this year. Expectations are very high for a March rate cut but that comes with question marks given the still-elevated inflation that we saw earlier this week; and many Fed speakers are pointing to the second-half of the year for the start of rate cuts after more data on the inflation-front can be seen.
But there’s a different outlay in USD/JPY than there was last year, and this is what’s likely behind the question of whether the carry trade is coming back or not.
The big difference between the 2022 and 2023 episodes can be drawn back to other currencies, such as the Euro or the British Pound. Because when the US CPI print was released in November of 2022, rate hike expectations were ramping up, driven by the expectation that the European Central Bank or the Bank of England would embark on a similar fight against inflation as what we had just seen from the Fed. This would entail larger rate cuts, and more aggressive tightening as central banks tried to get inflation under control. That helped to boost the value of the Euro and the British Pound, which also served to help to soften the USD, because an important point must be considered: The USD, as the DXY instrument, is merely a composite of underlying currencies.
So one of the factors that helped USD/JPY to snap back so aggressively in Q4 of 2022 was the fact that he USD was getting hit – aggressively – as not only was there a pricing-in of a softer Fed on the back of slower inflation data, but there was also the deviation in rate expectations that had begun to price in elsewhere. As the USD got hit, on a relative basis, that further compelled carry unwind in USD/JPY.
The reason that this matters is because for the more recent episode, those higher rate expectations out of Europe or the UK aren’t quite the same as what we had seen previously, and this has helped the USD to hold up a bit better during the 2023 scenario compared to what was seen in 2022.
In USD/JPY, we can see some of that aggressive bearish behavior pricing in after the CPI release last November; but unlike the prior year, the more recent episode has been coupled with aggressive pullbacks and two-way price action. There was a strong support bounce at the 23.6% Fibonacci retracement of that prior major move, plotted at 140.30, and that currently constitutes the five-month low in the pair.
USD/JPY Daily Chart
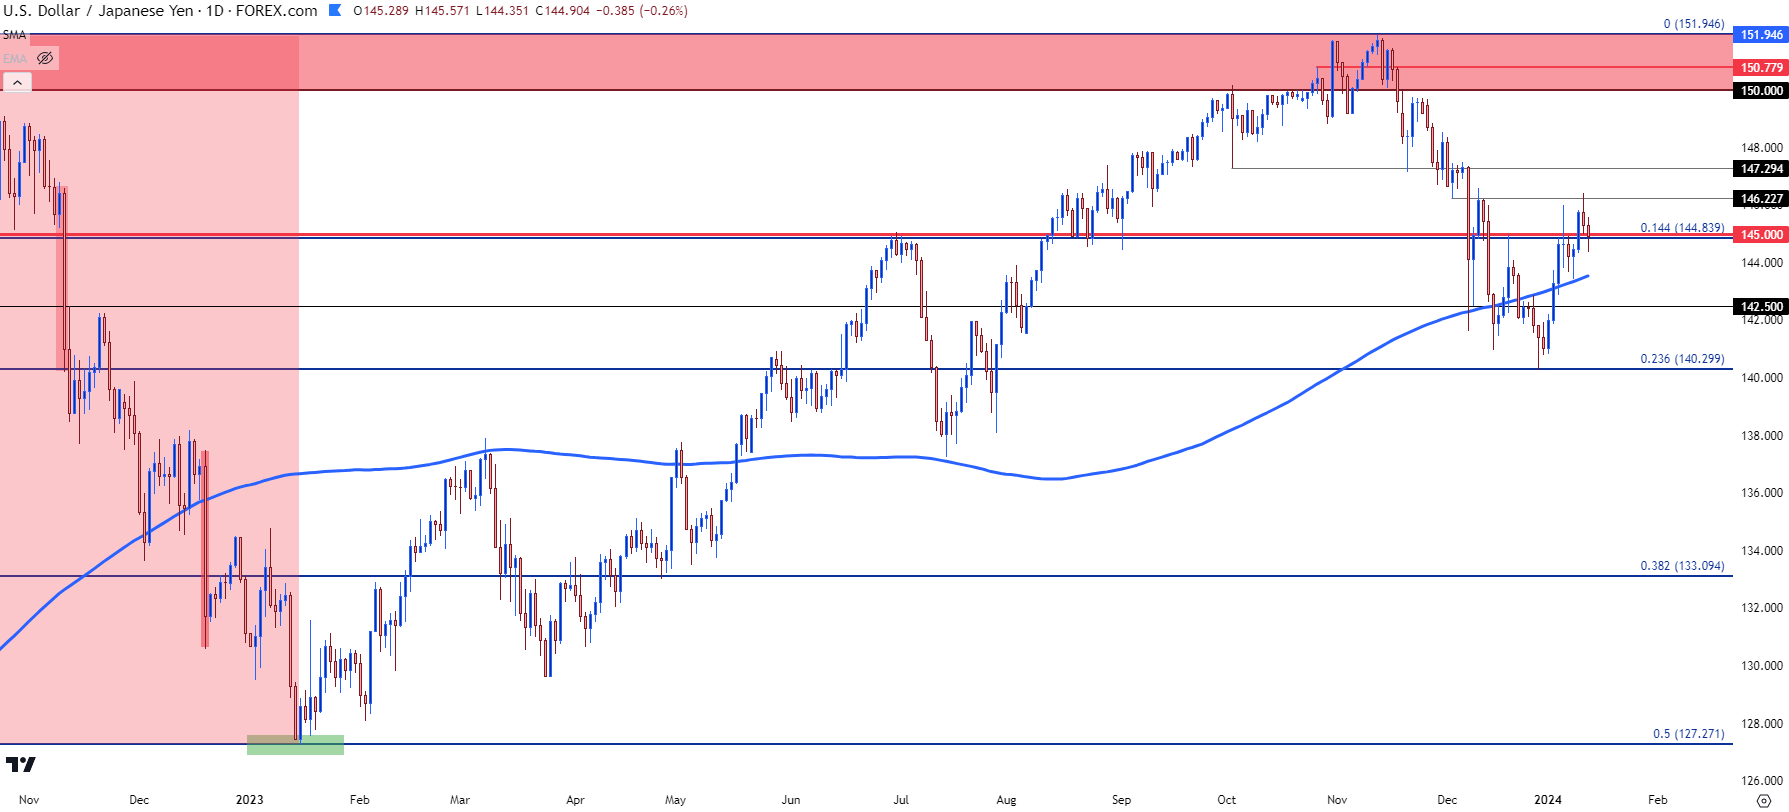 Chart prepared by James Stanley, USD/JPY on Tradingview
USD/JPY Short-Term Bullish Structure
At this point, regardless of one’s fundamental bias, the fact of recent bullish structure as taken from the daily chart cannot be denied. The big question is whether the trader wants to try to go with that flow on the daily or, instead, position for a bearish episode, which can entail waiting for a higher level of resistance to come into play, or perhaps, waiting for sellers to take another first step. This would come with the idea that this recent bullish structure is coming into question.
From the daily chart below, we can see the bounce from the 140.30 Fibonacci level that began in the final days of 2023 trade. The high this week was 146.42, denoting a run of greater than 600 pips in just a couple of weeks. This illustrates the fact that aggressive trends can also show sizable pullbacks; but so far buyers have chewed through a few different areas of resistance and there remains both higher-highs and higher-lows. There’s also a key level that’s in-play right now, around the 145 handle that buyers are attempting to hold into the close of this week.
The most recent higher-low was at 143.42, very near the 200-day moving average which remains a key point of interest; so this would be the spot that bulls would want to hold to continue the topside sequence. Below that, there’s a Fibonacci level at the psychological level of 142.50 and a test there would indicate that buyers are starting to lose the handle, and that would open up the possibility of short-term lower-high resistance around that 143.42 area, or perhaps even the 144.84-145.00 spot.
As for next resistance, the big zone that sticks out was a spot of support that was in-play in late-November and early-December. This runs from prior price swings of 147.37 up to 147.87. This zone showed as resistance in late-Q3 as the trend was continuing higher; and then became support as the market began to break down in Q4. There’s also a Fibonacci level of 146.66 but that’s a mere 24 pips above the prior high; but that does remain of interest if bulls are able to continue pushing this short-term trend.
USD/JPY Four-Hour Chart
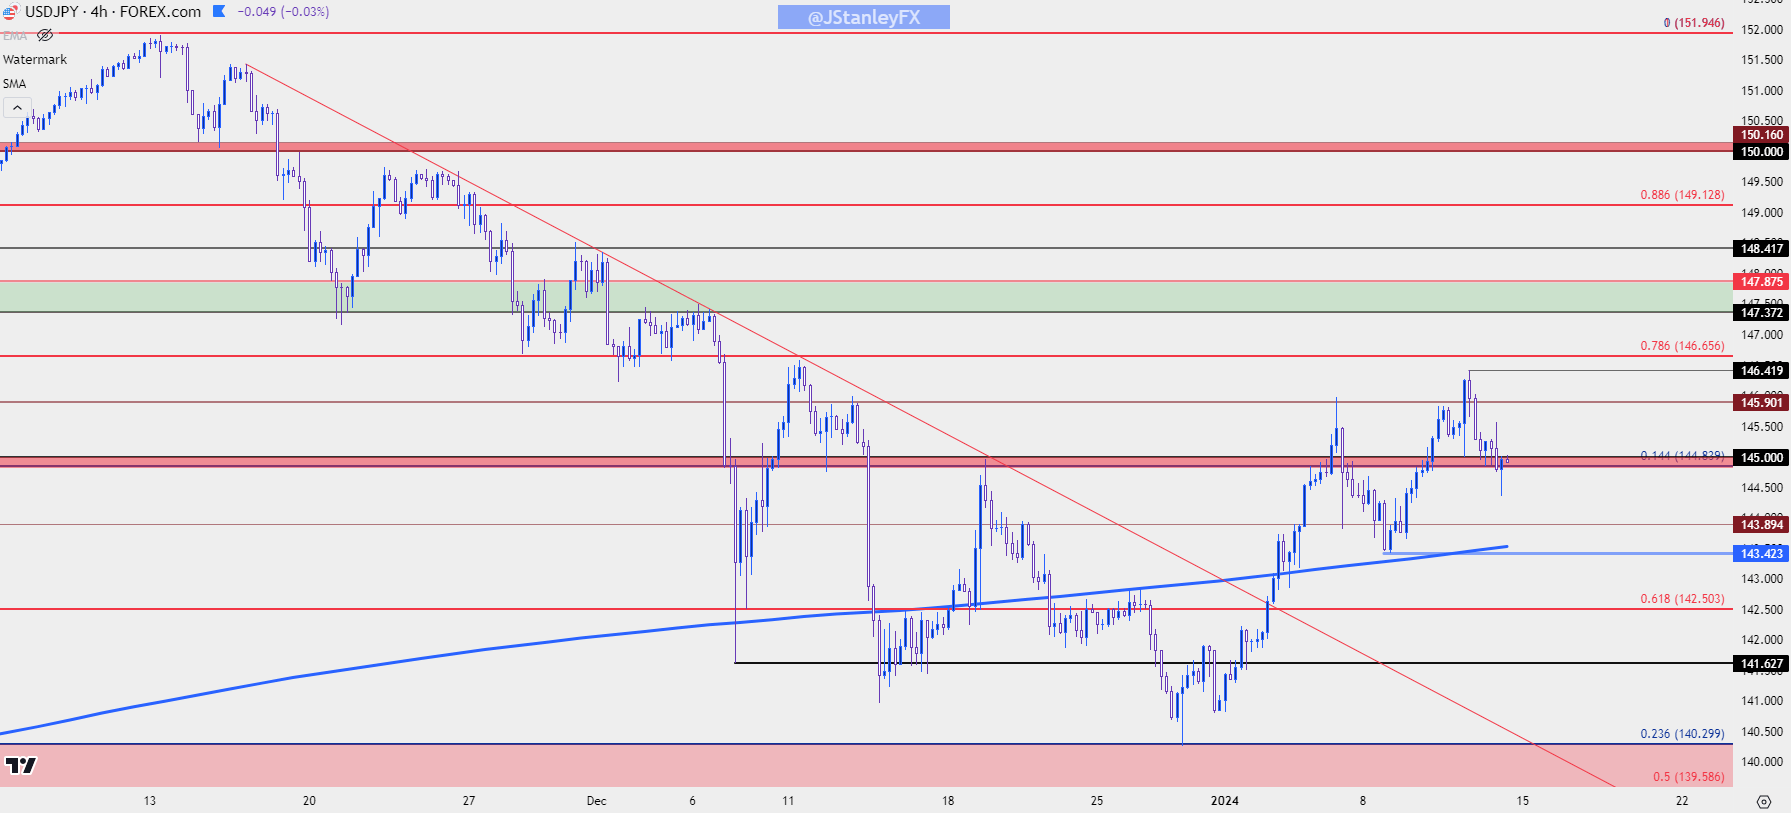 Chart prepared by James Stanley, USD/JPY on Tradingview
EUR/JPY
While USD/JPY tested below the 200-day moving average in December, and then finally climbed back-above in early 2024-trade, EUR/JPY found a strong theme of support at its own 200 DMA in late 2023. There were multiple tests of that level but notably, not a single daily close below while USD/JPY traded below its 200DMA for a couple of weeks. I had highlighted this just ahead of the holidays as that support test in EUR/JPY then led to a strong push into a longer-term zone of interest. Bulls continued to push higher lows after that, including another test of the 200-day, which eventually led to a re-test of the 160.00 psychological level.
This would show a bit more strength than what was looked at above, and for traders looking at Yen-weakness scenarios this could be more attractive than USD/JPY given current backdrop, although GBP/JPY may have an even stronger claim than EUR/JPY.
In EUR/JPY, there’s support potential near 157.58, and below that is a prior swing around 156.50. The 200-day moving average currently projects to around 155.66 and this would the spot of support that bulls would want to hold to retain the trend.
EUR/JPY Daily Chart
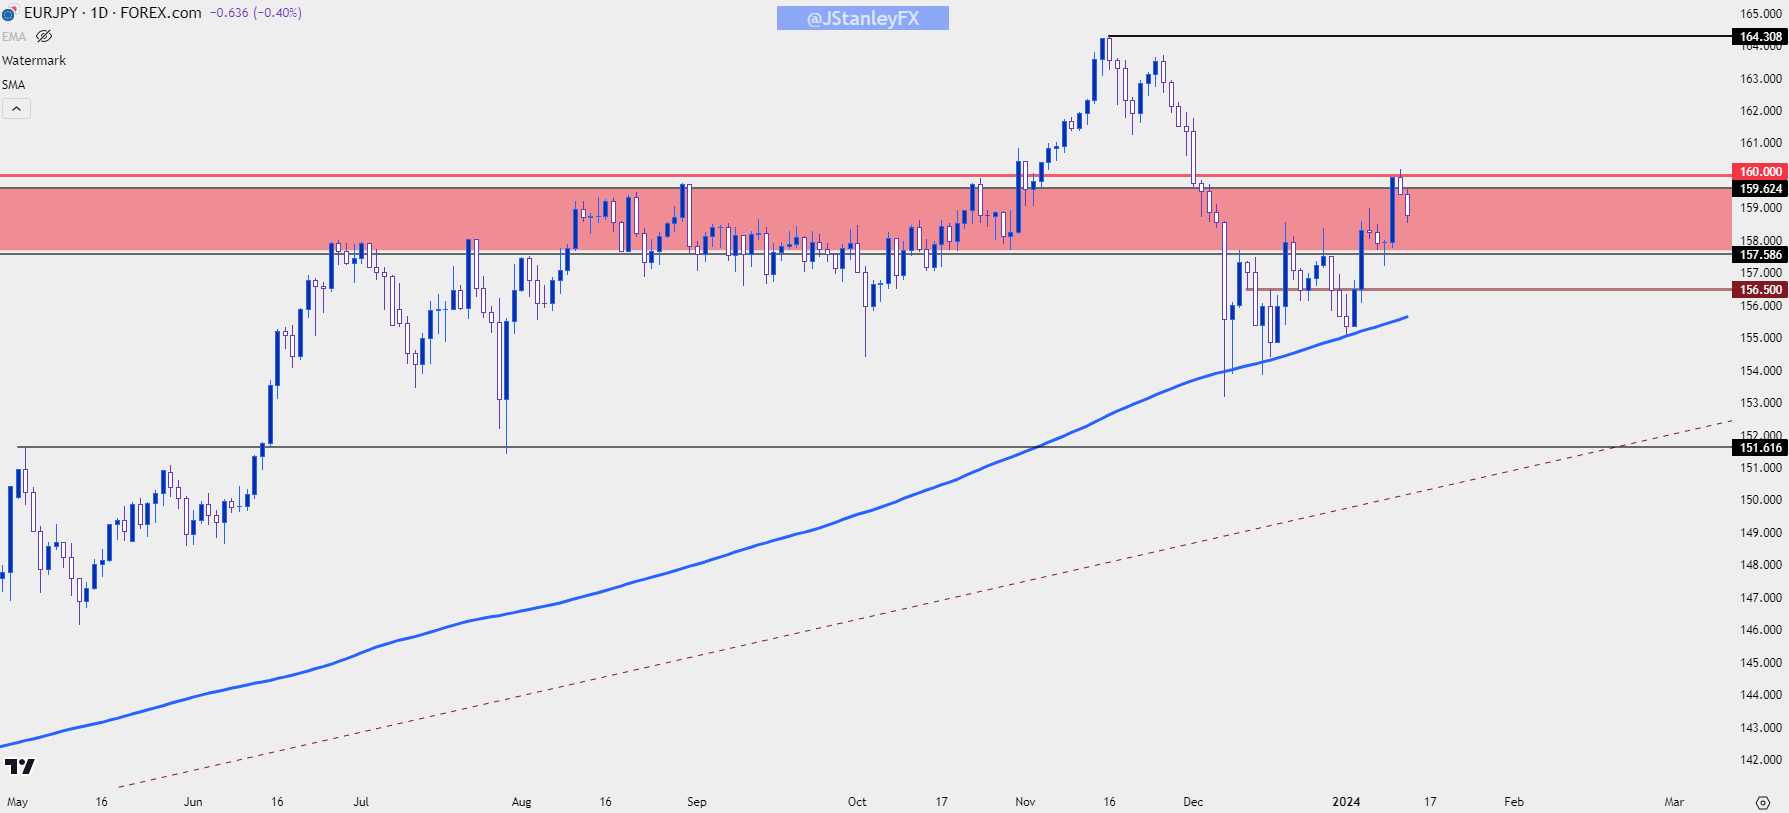 Chart prepared by James Stanley, EUR/JPY on Tradingview
GBP/JPY
While USD/JPY traded below its 200-day moving average and EUR/JPY danced on its 200DMA for support in December and early-January, GBP/JPY had a touch-and-go relationship with its own 200-day moving average. As Yen weakness has come rushing back in 2024, along with those question as to whether the carry trade is returning, GBP/JPY has put in a sizable move to test back above the 185.00 level.
For traders looking for Yen-weakness that can make an attractive case when compared to USD/JPY or EUR/JPY. Of course, things can change, but the fact that inflation remains elevated, and the BoE has to remain at least somewhat hawkish could further enforce the fundamental dynamics behind that deviation.
There’s a couple of spots of support for buyers to defend: The 183.94 Fibonacci level remains of interest; but if that doesn’t hold, the concern would be longer-term mean reversion, and that could point to another re-test near the 180.00 psychological level, which is currently confluent with the 200-day moving average.
GBP/JPY Daily Price Chart
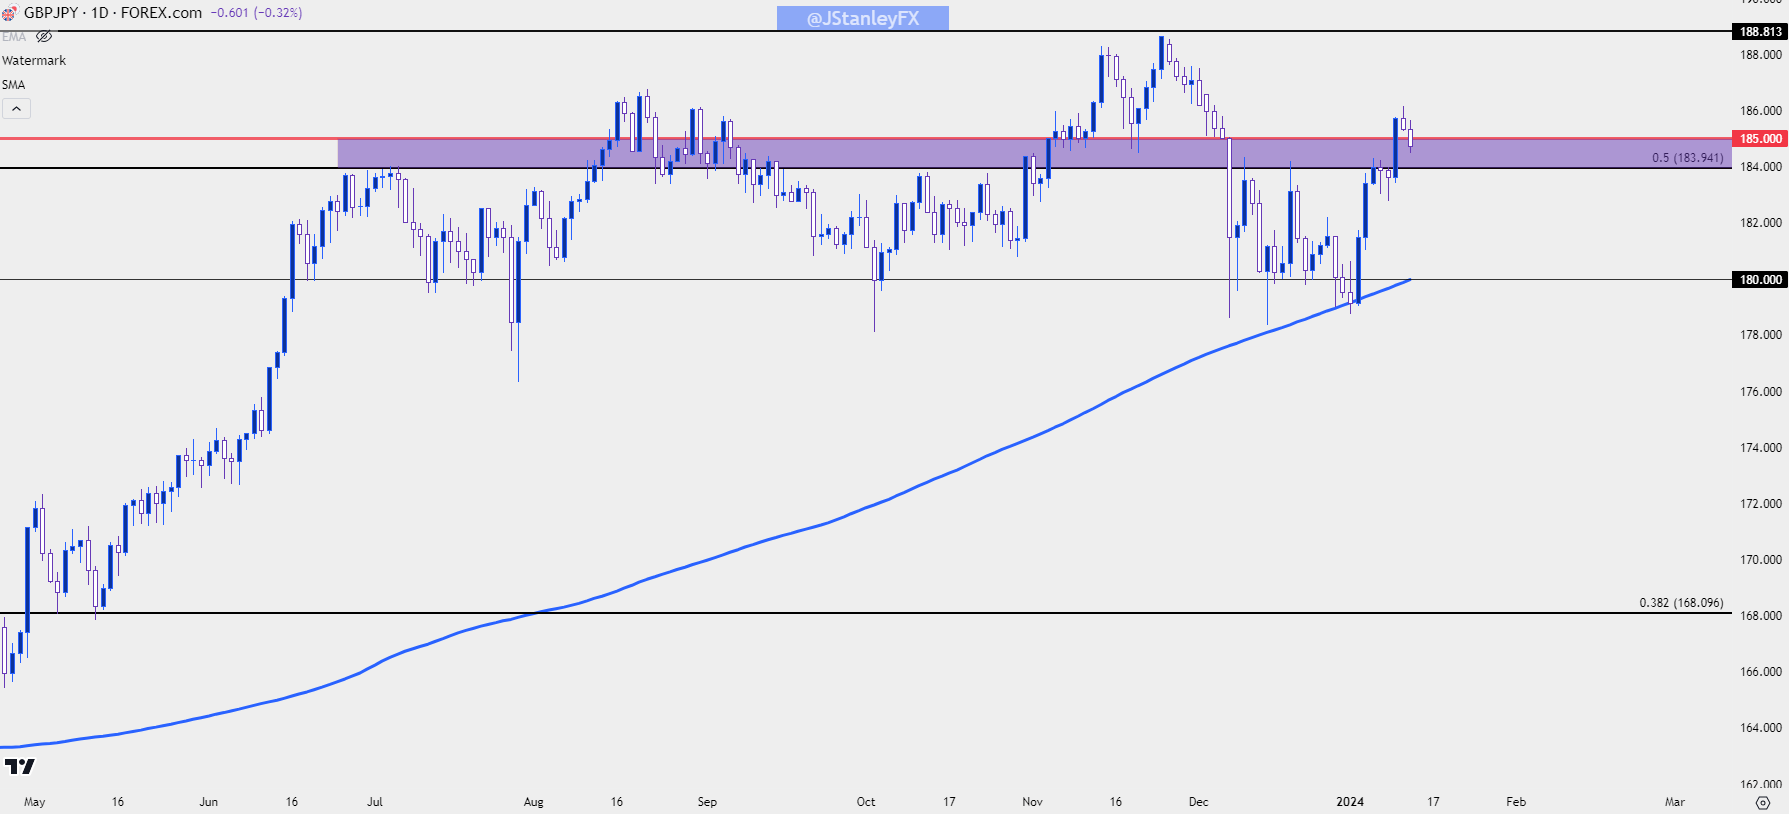 Chart prepared by James Stanley, GBP/JPY on Tradingview
So… Is the Carry Dead, or Coming Back?
The best answer to this question, in my opinion, comes from longer-term charts. And as I had shared in late-December I think that both USD/JPY and EUR/JPY could be near longer-term tops. GBP/JPY, on the other hand, may have more room to go as there’s a longer-term spot of resistance that sits higher on the chart and hasn’t yet been tested.
From the monthly chart below we can see that area from the gap taken from August-September of 2007, which runs from 193.61 up to 198.08. Yes, it is a massively wide zone but this is drawn from a monthly chart. More important, this was the zone that capped the advance in 2015 so there’s some historical relevance up there.
GBP/JPY Monthly Chart
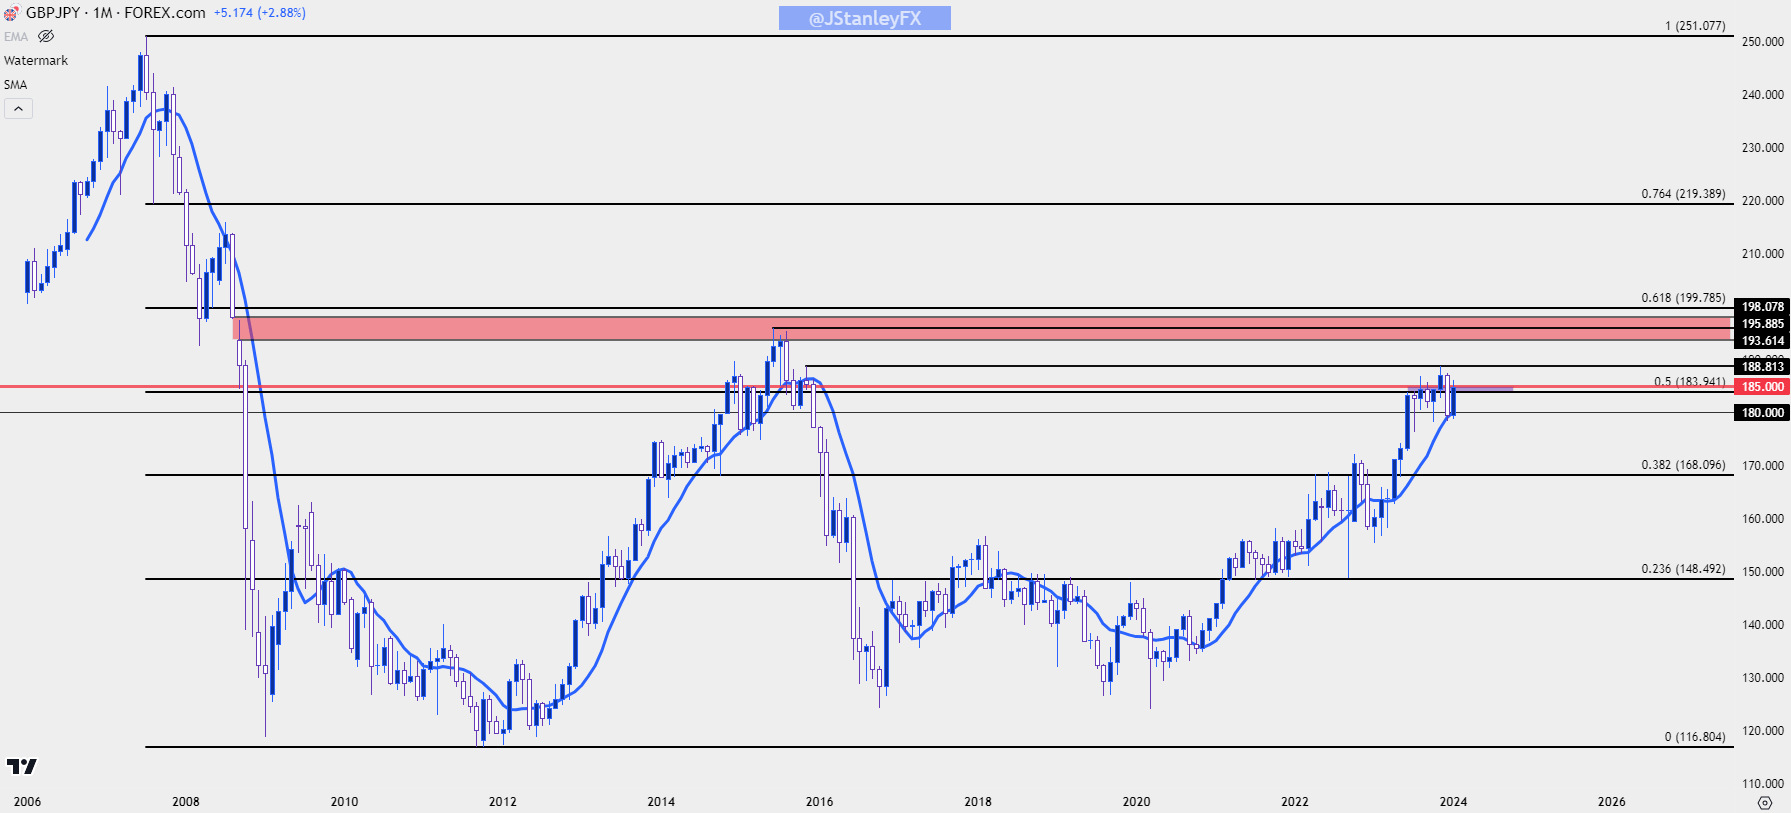 Chart prepared by James Stanley, GBP/JPY on Tradingview
EUR/JPY, on the other hand, is seeing a bit of struggle when testing that same zone derived from the gap between the August and September 2007 open. The bottom of that zone is the spot that I noted for support potential above, around 157.59, and the top of that zone is just inside of the 160.00 psychological level.
EUR/JPY Monthly Price Chart
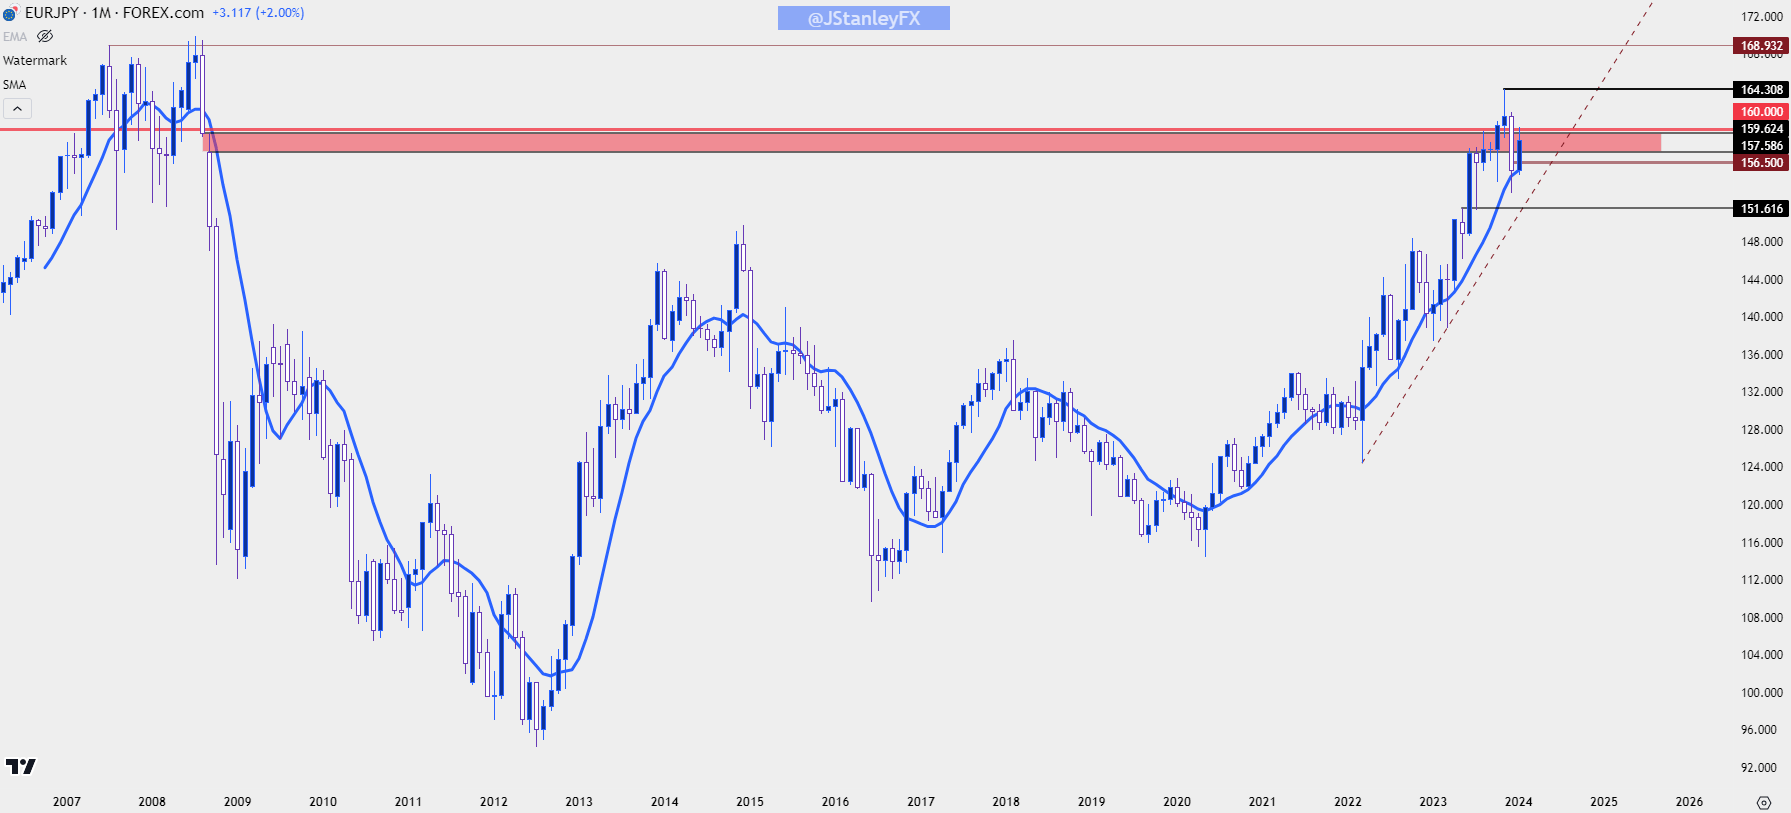 Chart prepared by James Stanley, EUR/JPY on Tradingview
USD/JPY
For Yen-bulls, USD/JPY may be more attractive given the fundamental backdrop and the fact that the Fed appears as though they really don’t want to hike rates again. The ECB has seemed to avoid the topic of rate cuts thus far and there was a clear divergence in December, when Christine Lagarde said that the conversation around rate cuts hadn’t even started whereas Jerome Powell admitted that in the United States, it has.
But, inflation remains problematic in the UK and the BoE may not have the same latitude for policy softening as the US or Europe; and thus this could keep the topside of GBP/JPY as more interesting until something shifts on that front.
In USD/JPY, the big question from the monthly chart is whether the double top formation begins to fill-in. This would require a breach of the support from last January, which is fairly far away. But if greater signs of carry unwind show in USD/JPY, as we saw in Q4 of 2022, the move can materialize very quickly and that would become a key spot of emphasis.
USD/JPY Monthly Price Chart
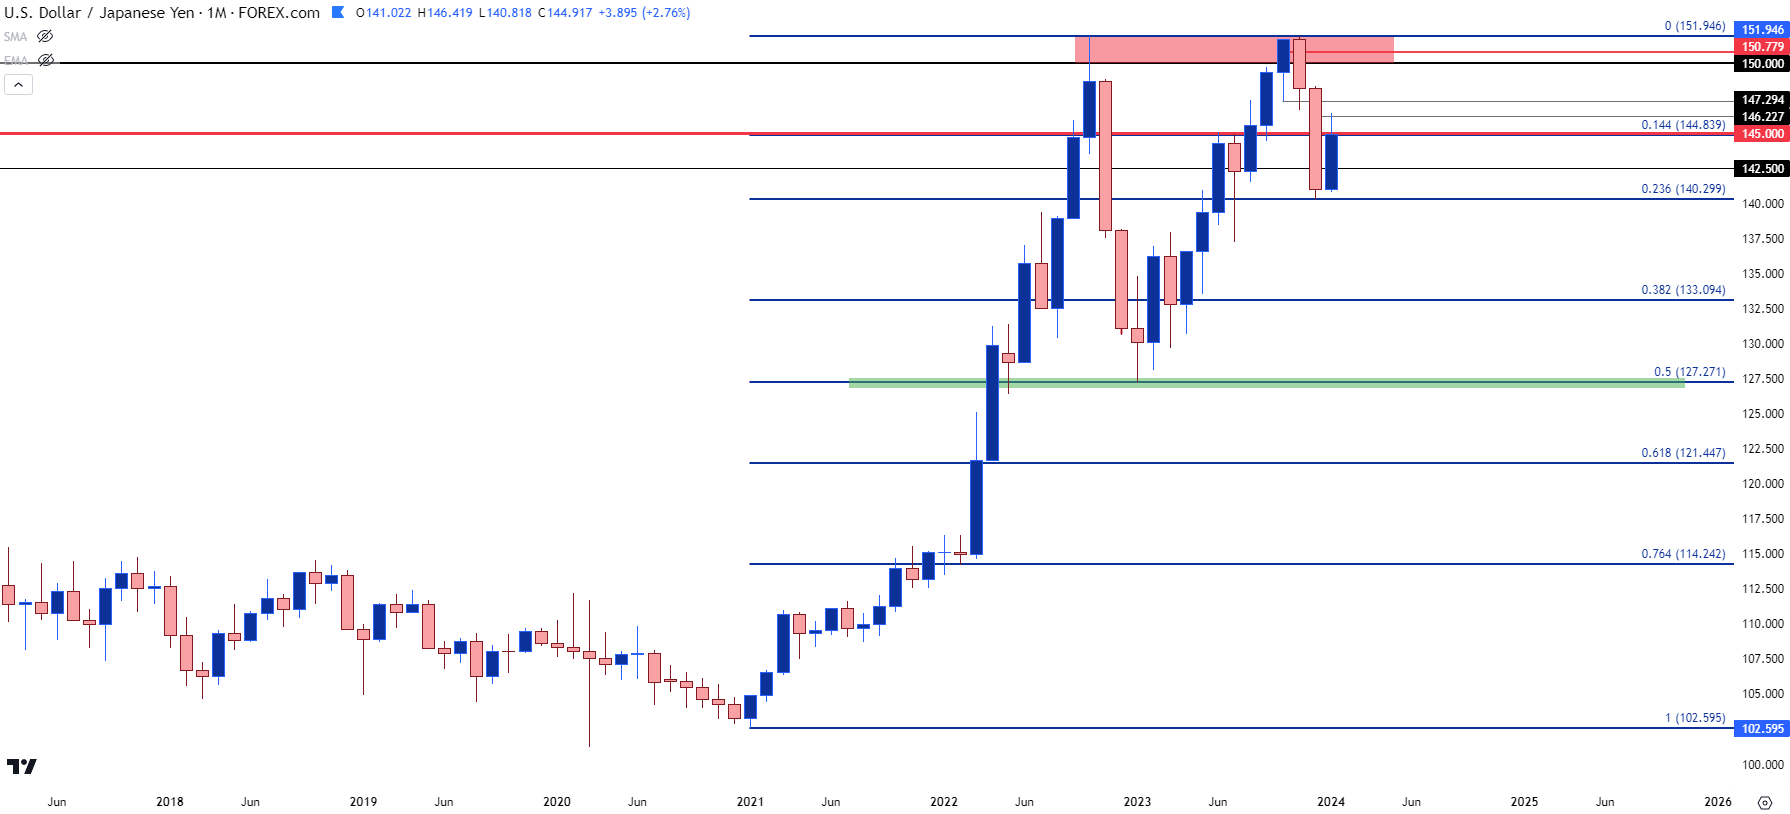 Chart prepared by James Stanley, USD/JPY on Tradingview
--- written by James Stanley, Senior Strategist
Latest market news
Yesterday 06:37 AM
April 26, 2024 01:25 PM
April 26, 2024 11:40 AM
Latest Trade Ideas articles


April 26, 2024 11:40 AM

April 25, 2024 03:00 PM

April 25, 2024 11:14 AM