

US Dollar Talking Points:
- We’re nearing the end of the year but there’s some heavy headline risk for this Friday, with Core PCE and Durable Goods data out of the US being released at 8:30 AM ET, followed by U of M Sentiment numbers at 10. This can prod some volatility into the USD as we move towards year-end.
- Last week’s FOMC rate decision was unusual in that Powell didn’t display much balance, instead taking a fairly dovish role which has helped to drive both the US Dollar and longer-duration yields lower, while pushing a very strong move in equities.
- Next year is an election year in the US and this can have a bearing on policy, which can have impact on markets. But also of note is the Japanese Yen carry trade which has started to show symptoms of unwind along with a European economy that doesn’t appear to be in great health.
- I’ll be discussing these themes in-depth in the weekly webinar on Tuesday. It’s free for all to register: Click here to register.
It’s been a fast year with numerous twists and turns; but as we near the end the US Dollar is very near where it had started. The 103.49 level was the first trade of 2023 and price is currently about -1.21% away from that level. As I’ve been saying for the past month and change, it would not surprise me to see DXY close near that level to form a doji for 2023 trade. This is still possible as there’s a batch of headline risk for Friday morning, which will then lead into the Christmas holiday on Monday and likely low liquidity conditions in the week that follows as New Years is on the following Monday.
I spent a lot of this webinar talking about 2024 and my expectations for that, but there’s some tape to get through before we get there. The US Dollar has held support at 101.77 and bounced up to resistance at 102.55, which has since held a lower-high. The big question now is whether this support gets some element of defense from bulls, and this will likely have relation with whether bears defend the 1.1000 handle in EUR/USD, which I’ll touch on in a moment.
Above 102.55, there are several possible resistance areas, such as 103.18; but it’s that 103.50 spot that has a lot going on with the yearly open, the 200-day moving average and the 50% mark of the 2023 rally in the DXY.
US Dollar Daily Price Chart (indicative)
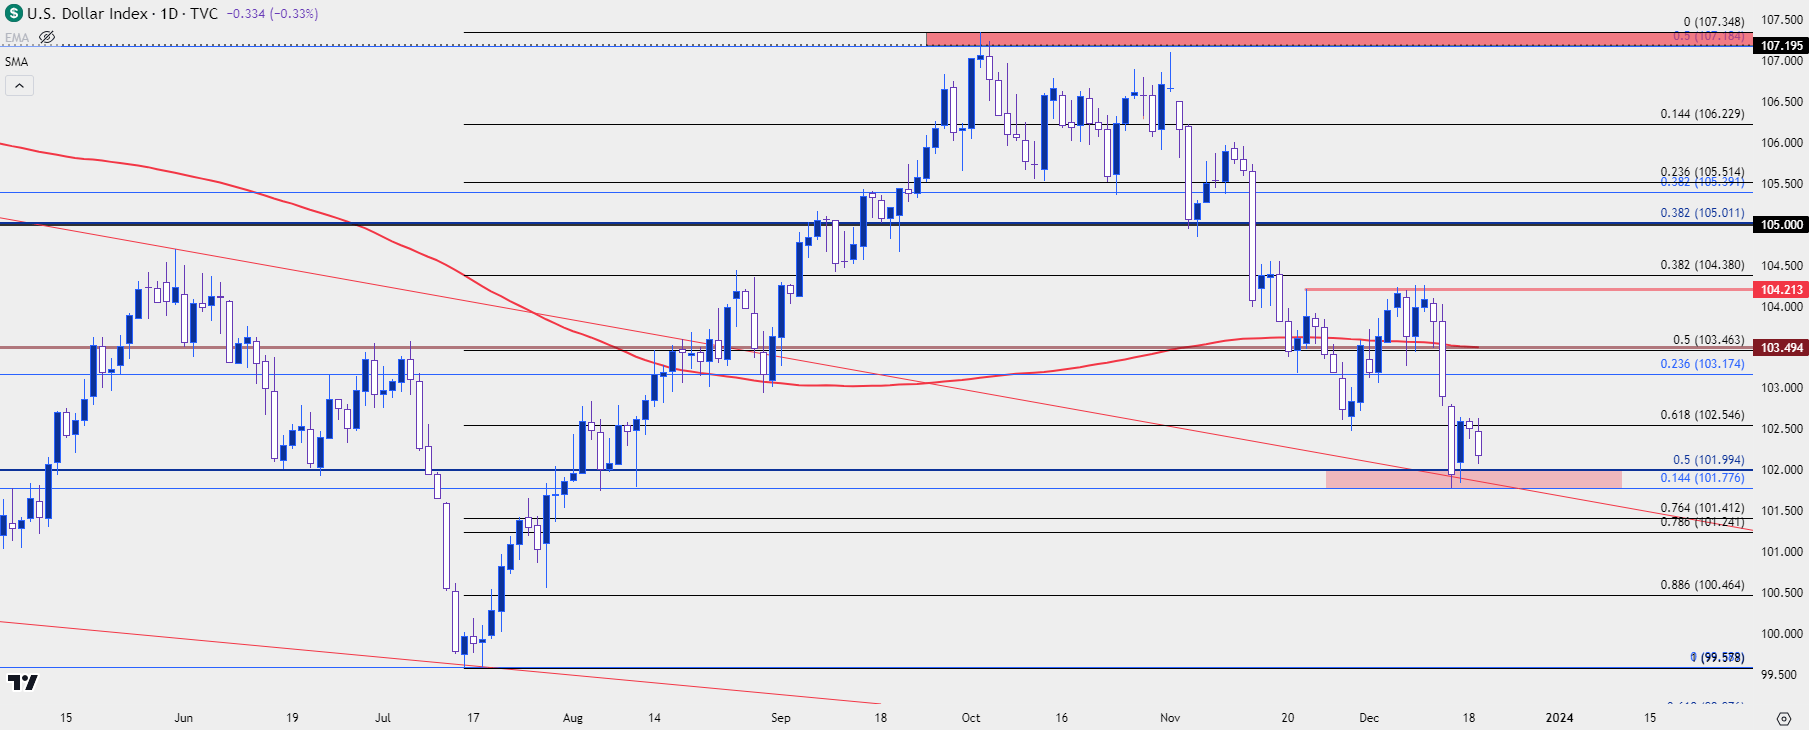 Chart prepared by James Stanley; data derived from Tradingview
EUR/USD
It was a strong two-day move in EUR/USD with FOMC and ECB last week. The support that I had looked at in last week’s webinar at 1.0750 held, and price posed a quick jump back-up to the 1.1000 level. This was the same spot that repelled bulls in late-November and the second test similarly saw bull bidding for breakouts fail; but the second instance has so far led to a higher-low and this is setting the stage for a third test of the big figure.
EUR/USD Daily Price Chart
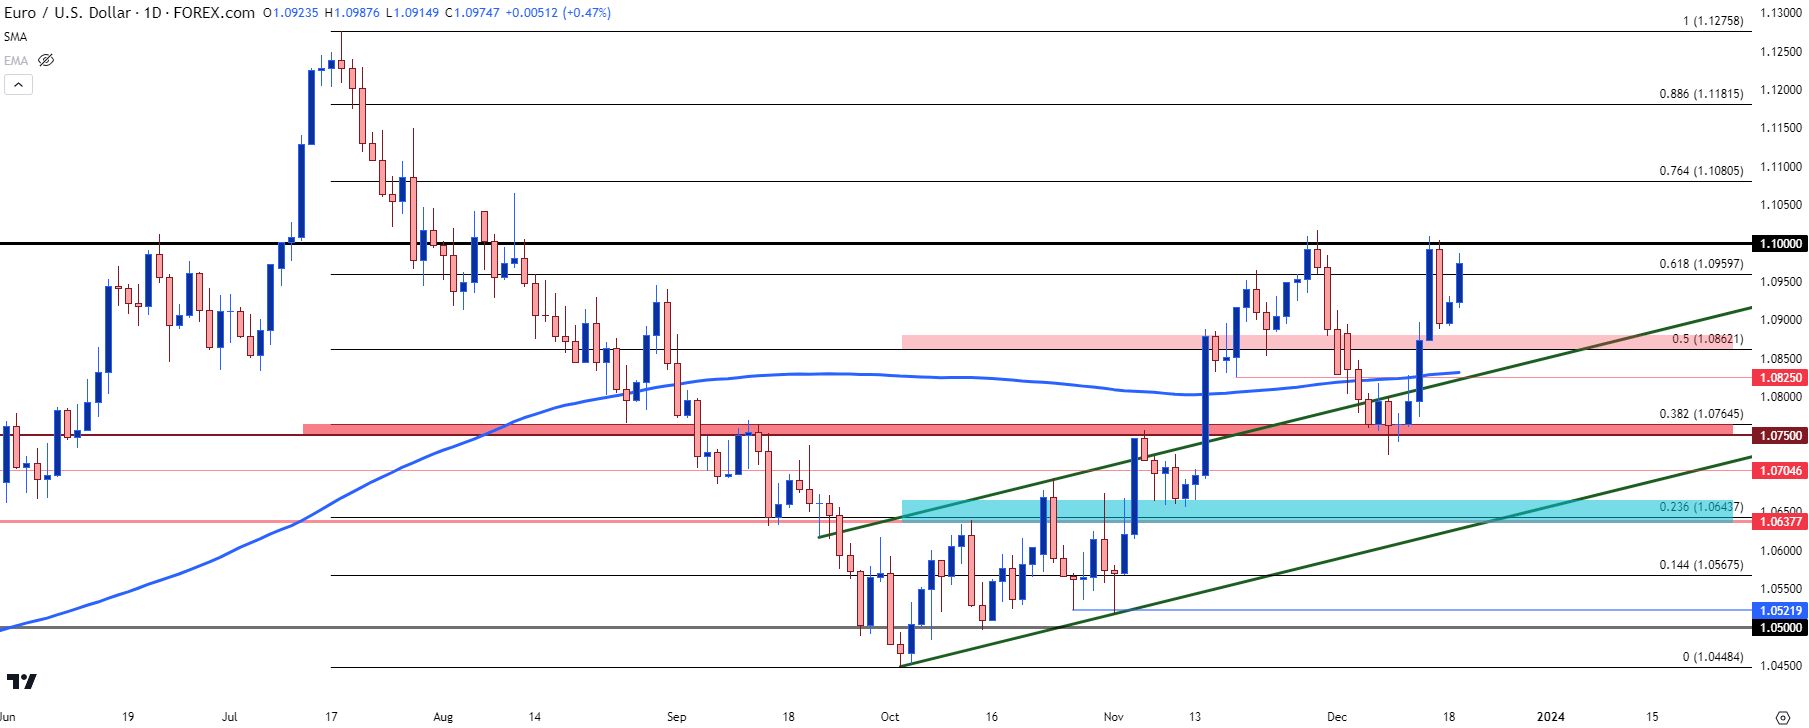 Chart prepared by James Stanley, EUR/USD on Tradingview
USD/JPY
I think the Yen is the one to watch for 2024. It’s not like Japanese monetary policy can get any weaker. This doesn’t mean that it will be a linear run of Yen-strength, but whether it’s from the weakness of counterparts getting rate cuts priced in, or whether it’s Yen-strength from traders unwinding carry bets in anticipation of some change from the Bank of Japan, there could be significant volatility on the horizon in many of these markets.
In the webinar, I shared why the BoJ might not necessarily be motivated to push this sooner rather than later. And before last night’s BoJ I had shared a few different setups on Yen-pairs. In USD/JPY, which has shown greater tendency of a bearish turn given the recent tests of the 200-day moving average, price posed a swift pullback to confluent resistance at 145.00 which has so far held as prices have pulled back as much as 140 pips.
USD/JPY Daily Price Chart
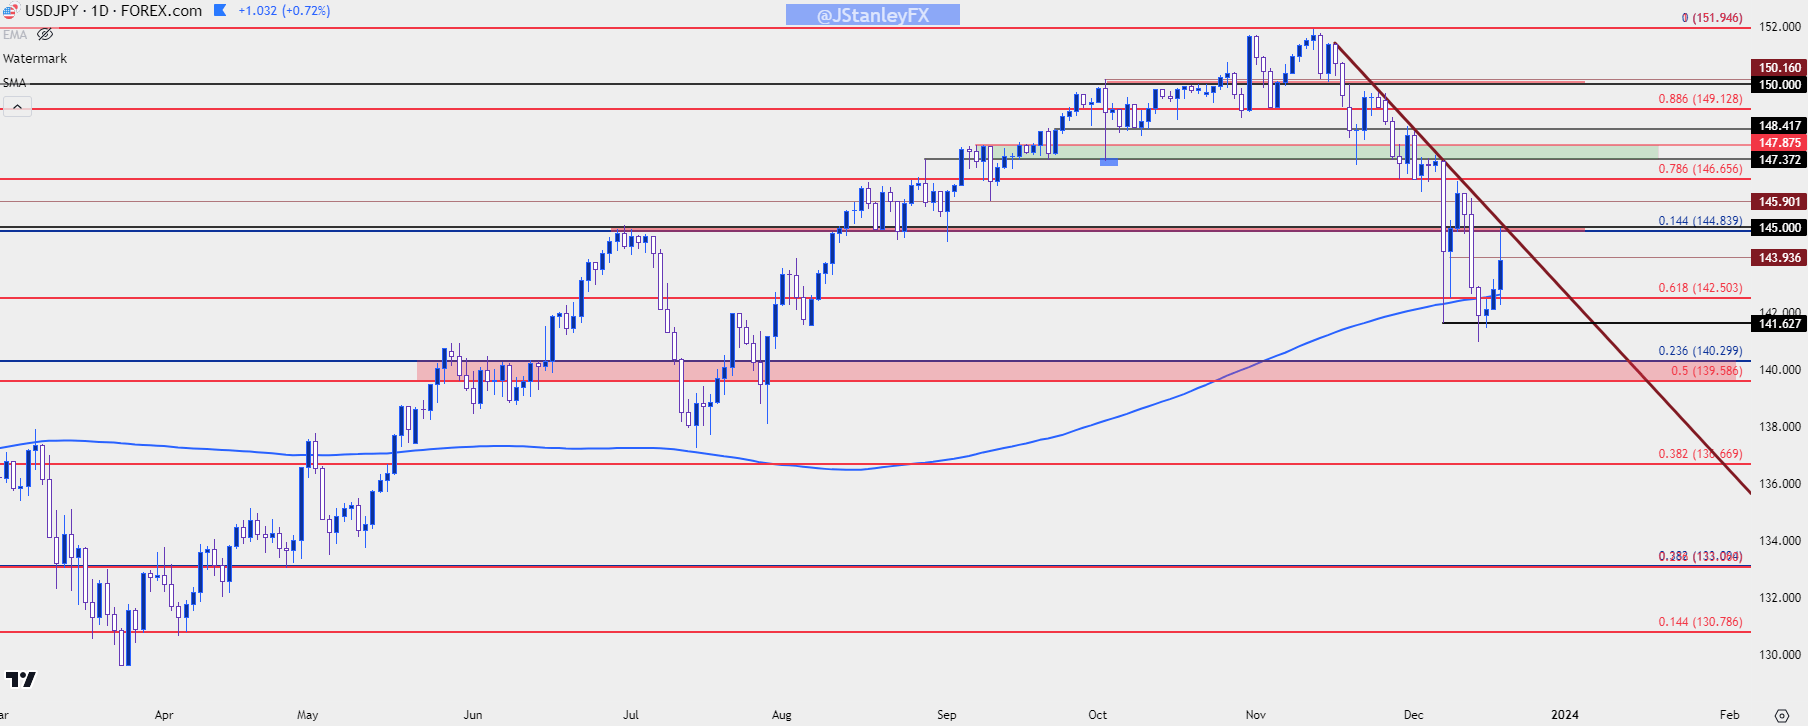 Chart prepared by James Stanley, USD/JPY on Tradingview
EUR/JPY
In the article that I published ahead of the BoJ yesterday, I highlighted how EUR/JPY has been testing its own 200 day moving average, but the tests there haven’t been as bearish as price has so far held above that level on a daily close basis, whereas USD/JPY has had a couple of daily closes below its own 200 dma.
So this wouldn’t bring the same appeal to bears just yet as there’s been a continued structure of higher highs and lows, and today is seeing price push up to a fresh higher-high; albeit in a spot of prior support. I had talked about the historical relevance of this zone in the webinar at length.
From the below chart we can see bearish potential as taken from the resistance test at prior support; but this wouldn’t look as bearish as USD/JPY, in my opinion.
EUR/JPY Daily Chart
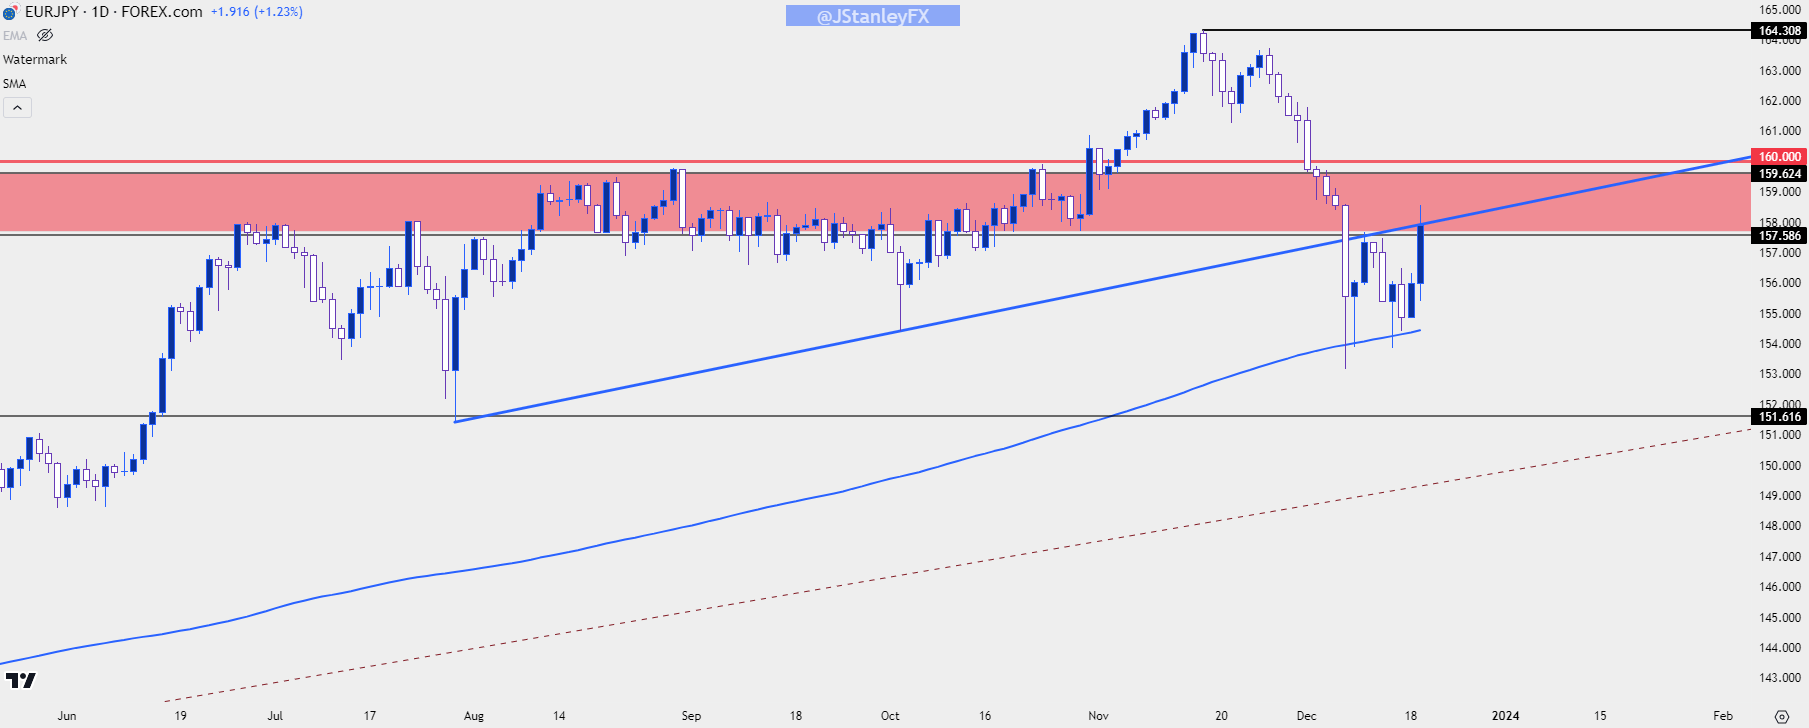 Chart prepared by James Stanley, EUR/JPY on Tradingview
GBP/JPY
Extending the sequence to GBP/JPY, and while USD/JPY has had a couple of daily closes below the 200 dma and while EUR/JPY has had a couple of support tests there, GBP/JPY hasn’t even touched its own 200 day moving average since March.
And if we look at rate decisions out of the US, UK and Europe last week, the Bank of England seemed to be the least dovish, saying that they were going to keep rates ‘sufficiently restrictive for sufficiently long,’ which stands in stark contrast to Powell who said the Fed have started to talk about rate cuts.
If we are going to see a prolonged bout of Yen-weakness, GBP/JPY could remain attractive, and I shared a long-term zone of resistance that I’m tracking for next year during the webinar. For now, GBP/JPY is testing resistance at a key Fibonacci level at 183.94. There was hard defense of support at 180 and this keeps the door open for bulls.
GBP/JPY Daily Price Chart
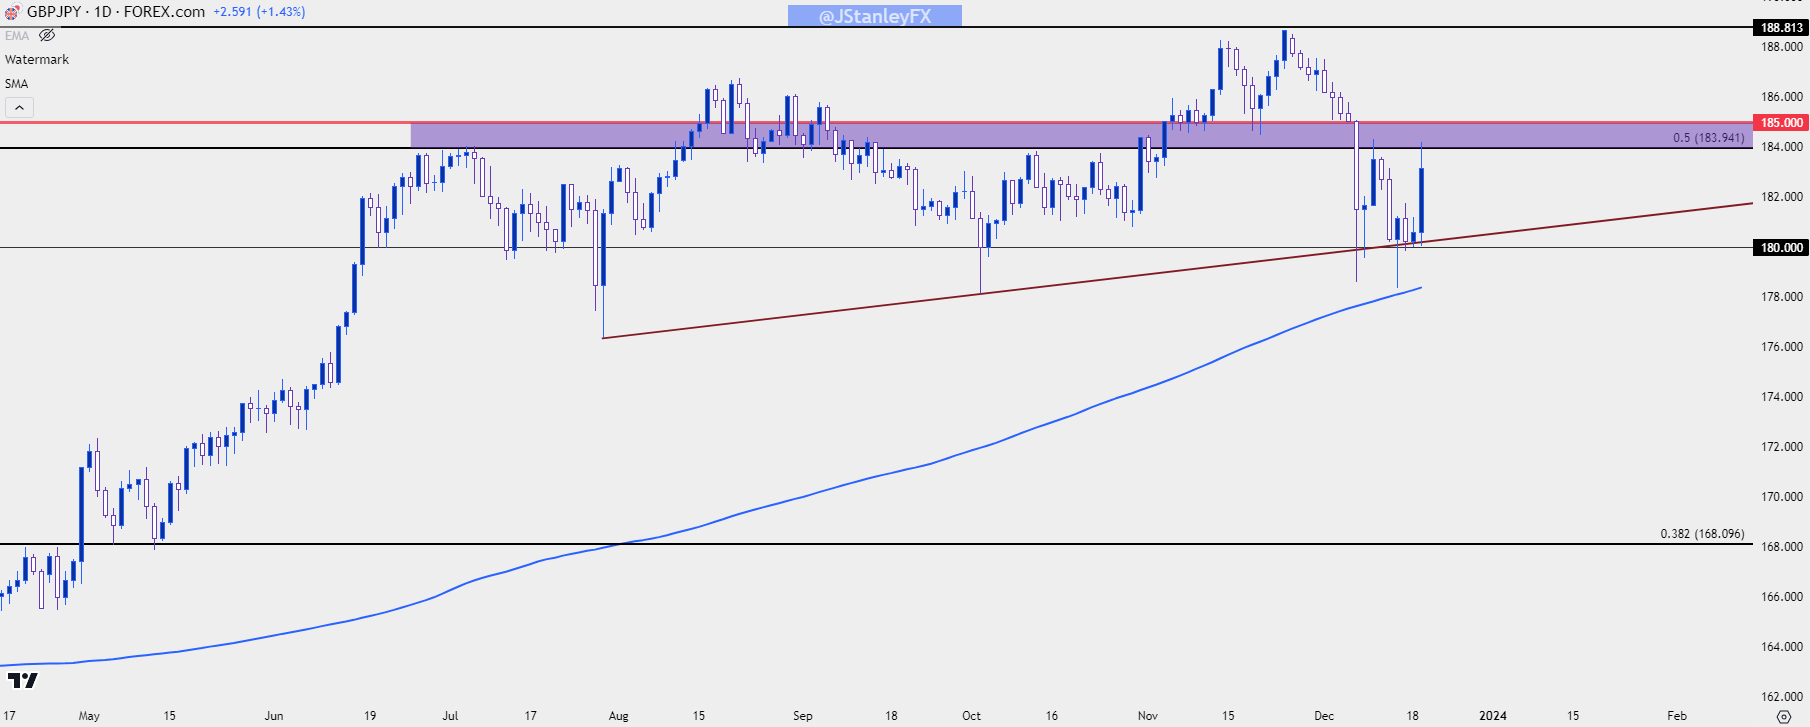 Chart prepared by James Stanley, GBP/JPY on Tradingview
Gold
I’m finishing this one with somewhat of a question mark.
I’ve long said that I think Gold can put in a sustained break above the $2k level once the Fed formally pivots. And while last week sounded close to that, I can’t come to terms with some of the peripheral factors, such as Core CPI still at 4% or the 10 year/3 month treasury spread moving deeper into inversion which I talked about for a bit in the webinar.
But, with that said the chart is the chart, and one of the benefits of employing price action is that there’s little need for question. At this point Gold is set up to test another bullish breakout and there’s a major zone of resistance sitting overhead from 2050 up to 2080. There’ve been multiple tests in this range over the past three and a half years, none of which have worked out well for bulls so far. We can see this setting up on the four-hour chart below.
Gold (XAU/USD) Four-Hour Price Chart
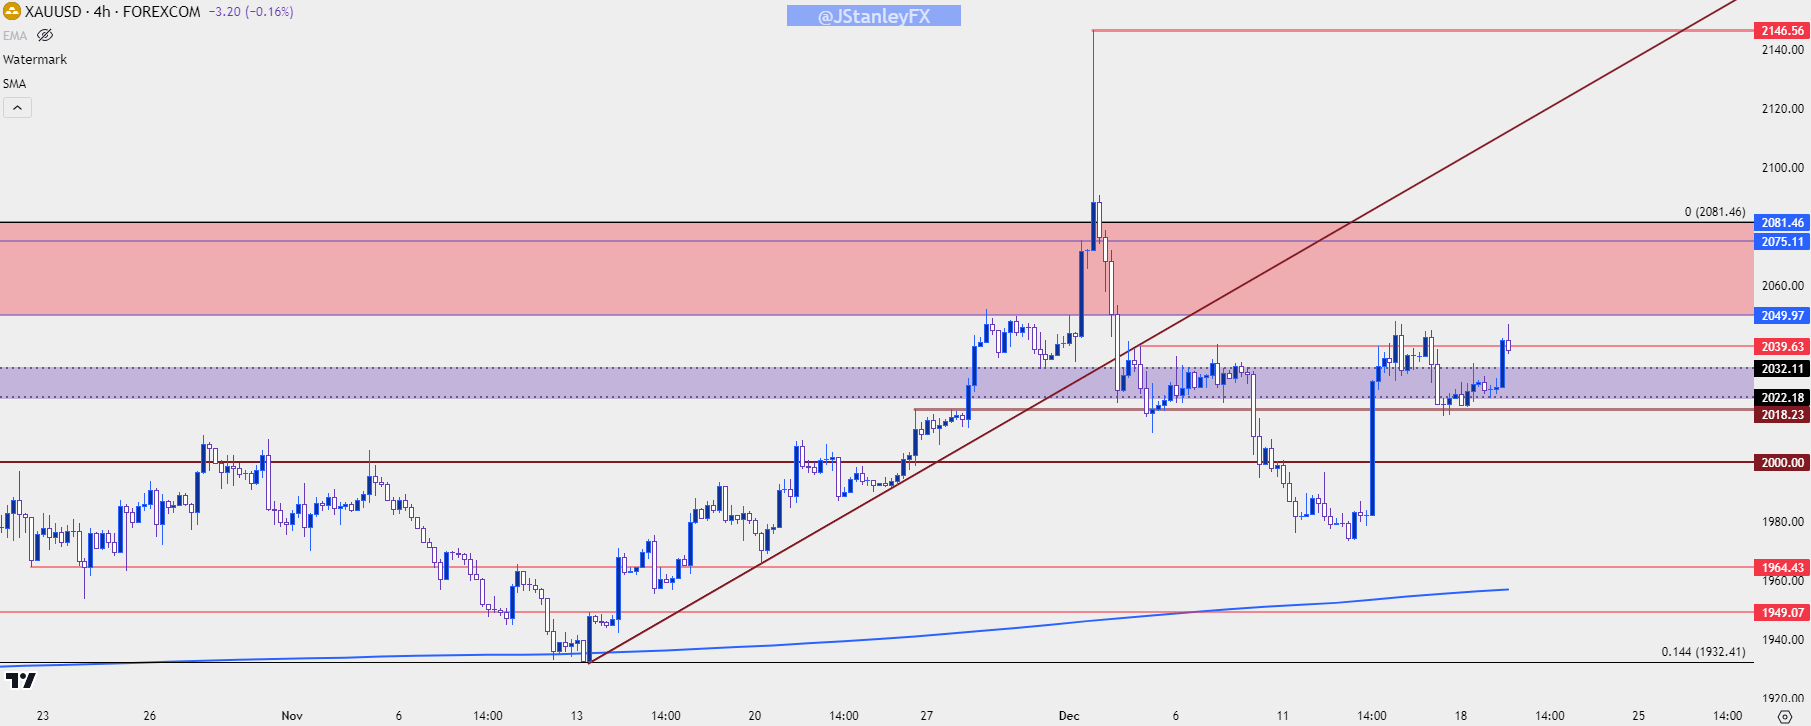 Chart prepared by James Stanley, Gold on Tradingview
If we do get the breakout, then the larger challenge can begin for bulls as this has been a restrictive area for topside themes for a few years now. The weekly chart highlights this well, and the big question remains whether buyers will get that motivation to drive above 2082 during holiday-thin liquidity conditions.
Gold (XAU/USD) Weekly Price Chart
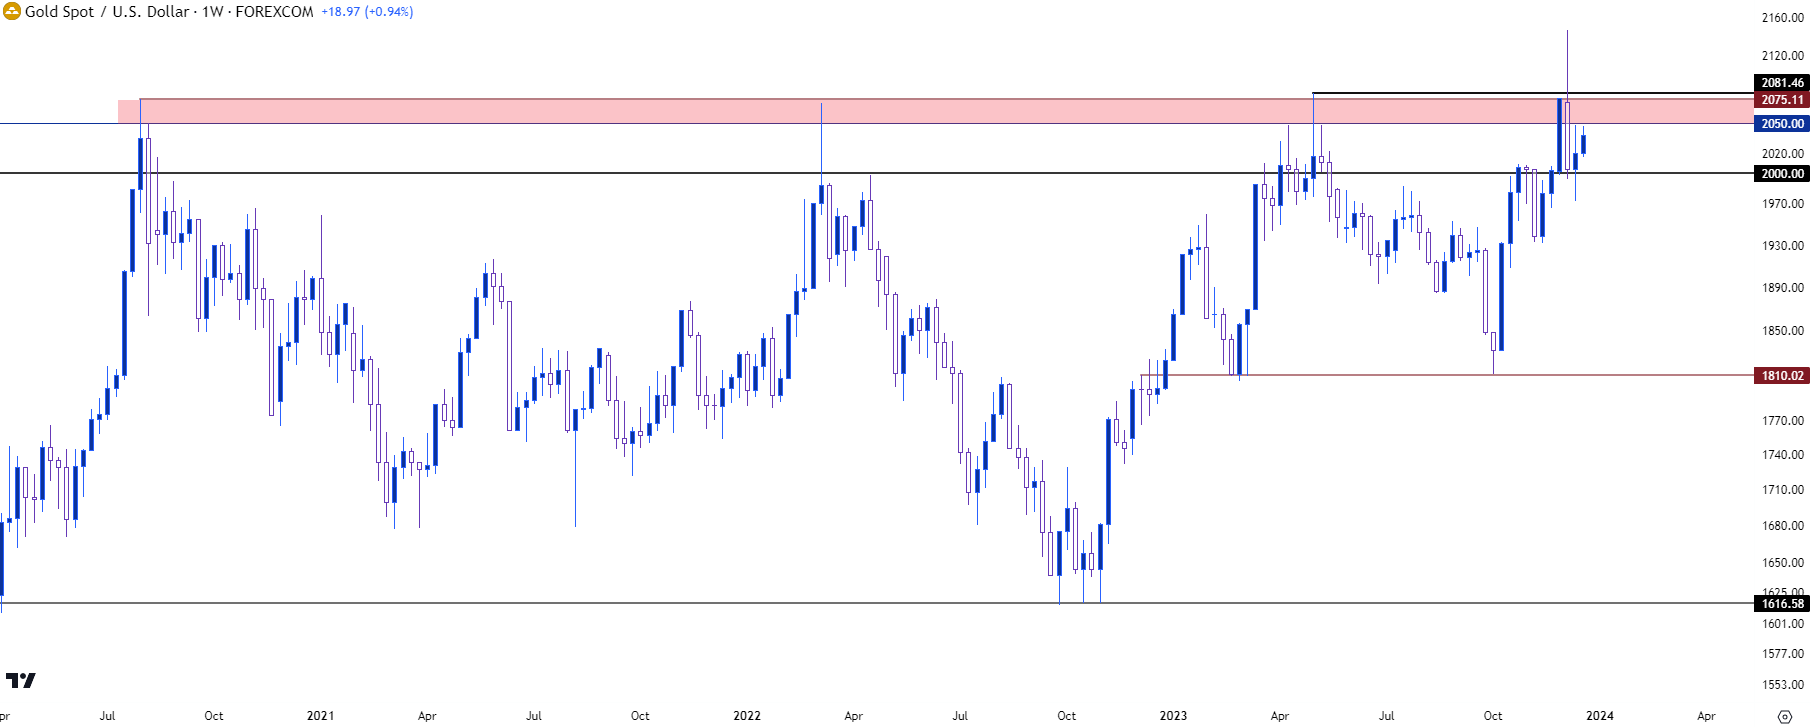 Chart prepared by James Stanley, Gold on Tradingview
--- written by James Stanley, Senior Strategist
Latest market news
Yesterday 01:32 PM
Yesterday 09:35 AM
Yesterday 07:23 AM
Yesterday 04:48 AM
Yesterday 12:17 AM
July 25, 2024 10:39 PM
Latest Trade Ideas articles

Yesterday 09:35 AM

Yesterday 12:17 AM

July 25, 2024 10:39 PM

July 25, 2024 05:30 PM