


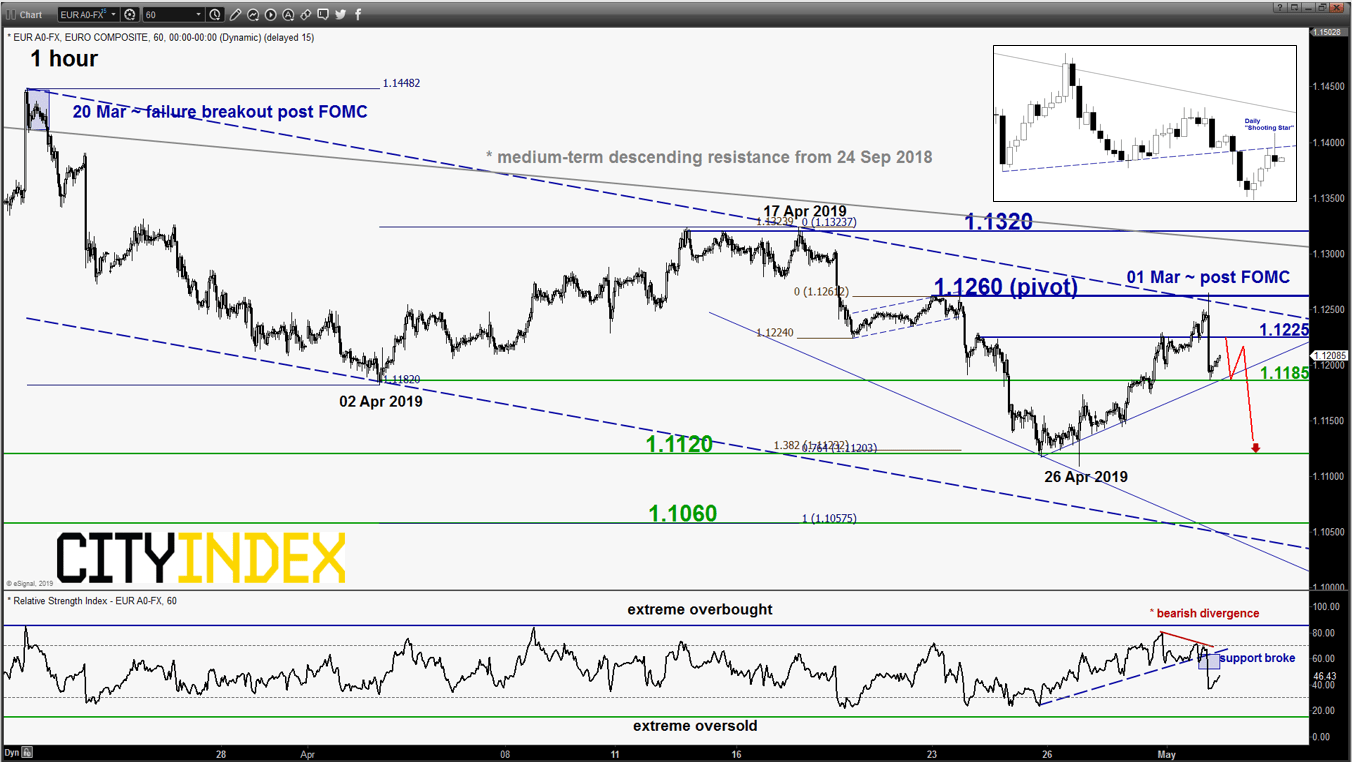
EUR/USD – 1.1260 is the key resistance to watch
click to enlarge chart
- Squeezed above the 1.1215 short-term pivotal resistance and underwent the alternate scenario; the extended corrective bounce towards the next intermediate resistance/alternate target at 1.1260 as per highlighted in our previous report. Click here for a recap; it printed an intraday high of 1.1265 in yesterday, 01 May U.S. session right after the announcement of the FOMC.
- Interestingly, it has reversed down and shaped bearish elements. It ended yesterday U.S. session with a bearish daily “Shooting Star” candlestick pattern right at the pull-back resistance of the former range support from 07 Mar 2019 low coupled with the shorter-term hourly RSI oscillator that has broken below a significant corresponding support.
- Maintain bearish bias with key short-term pivotal resistance at 1.1260 and a break below 1.1185 reinforces a further potential push down to retest 1.1120 in the first step. On the other hand, a clearance with an hourly close above 1.1260 invalidates the bearish scenario for a further push up towards the key 1.1320 medium-term resistance.
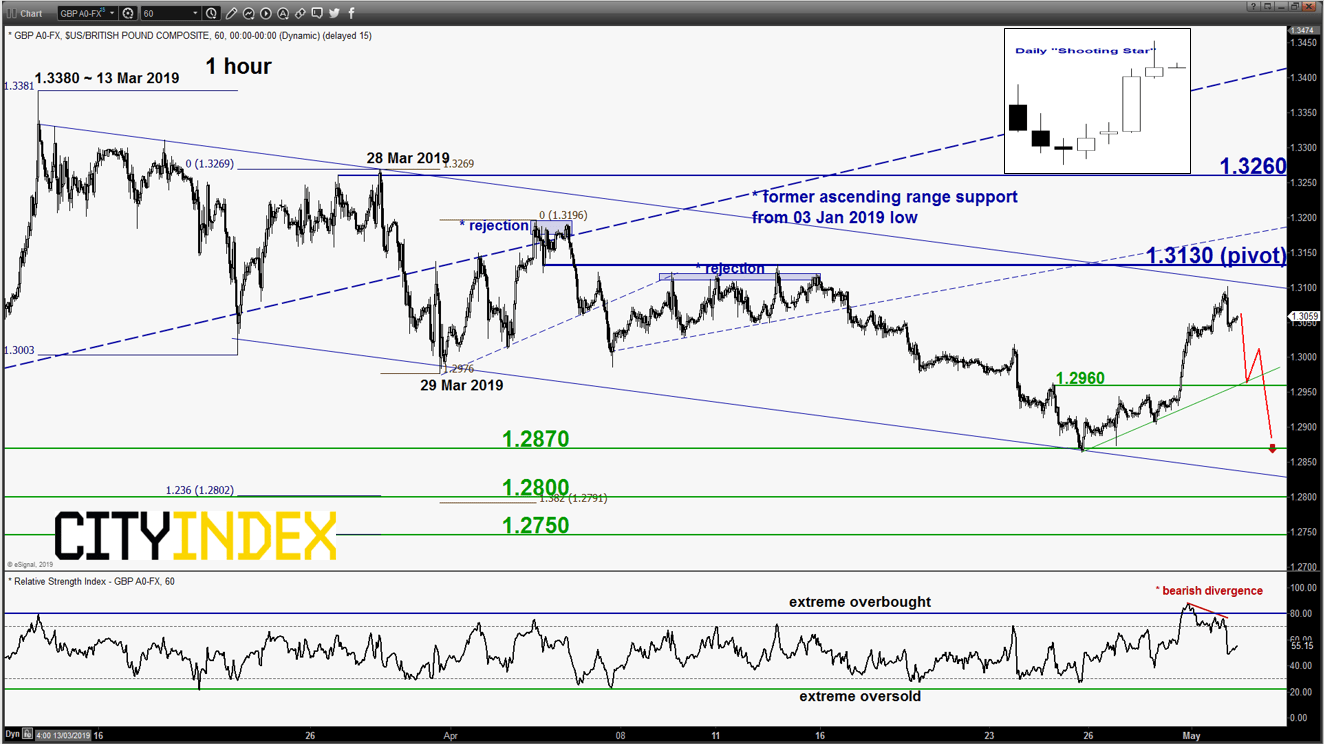
GBP/USD – 1.3130 is the key resistance to watch
click to enlarge chart
- Further squeezed up above 1.2985 and almost met the 1.3130 resistance/alternate target as per highlighted in our previous report. It printed a high of 1.3102 in yesterday U.S. session before it reversed down post FOMC and ended with a bearish daily ‘Shooting Star” candlestick pattern.
- Short-term momentum has turned negative where the hourly RSI oscillator has exited its overbought region after a prior bearish divergence signal. Maintain bearish bias with 1.3130 as the key short-term pivotal resistance for a further potential push down to target the near-term support of 1.2960 follow by the 25 Apr 2019 swing low of 1.2870.
- On the other hand, an hourly close above 1.3130 invalidates the bearish scenario for a further push up towards the next intermediate resistance at 1.3260 (28 Mar 2019 minor swing high area & 61.8% Fibonacci retracement of the entire slide from 13 Mar 2018 high to 25 Apr 2019 low.
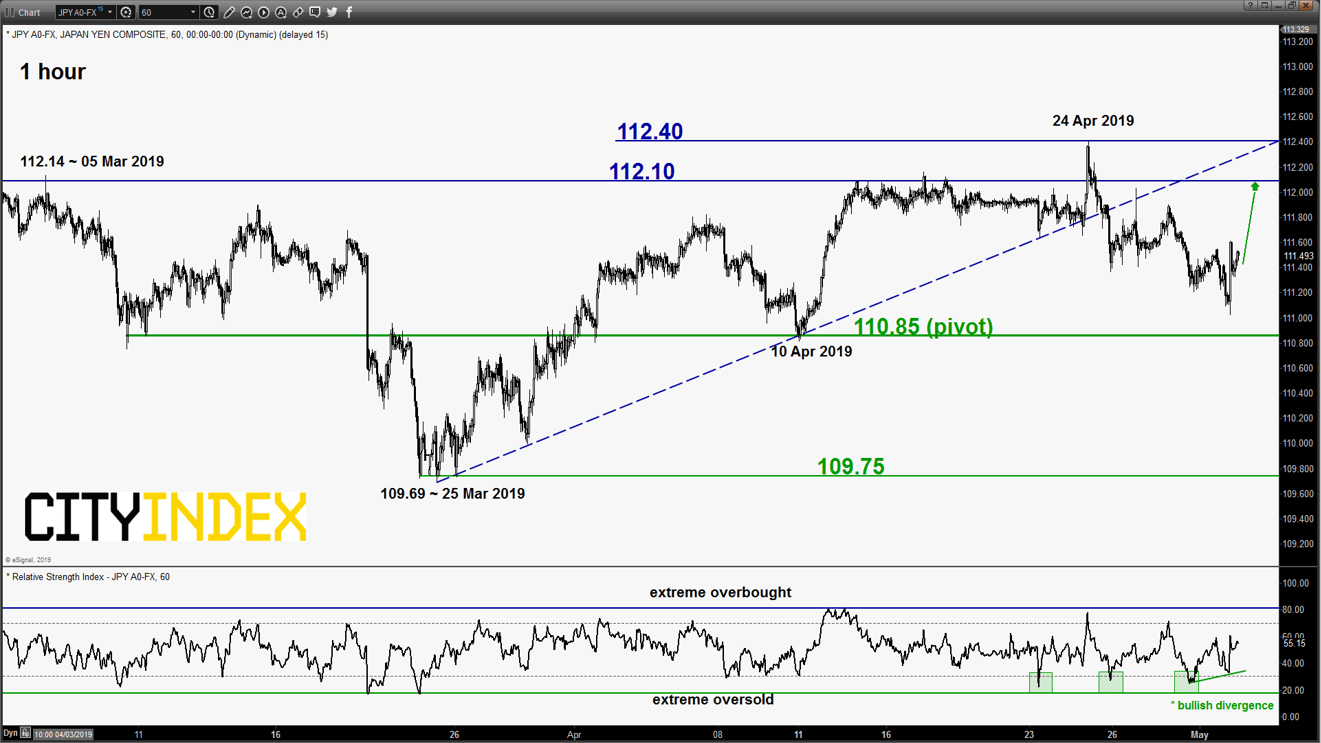
USD/JPY – Push up within range
click to enlarge chart
- Broke below 111.45 lower limit of the short-term neutrality zone as per highlighted in our previous report. It drafted down lower and almost met the support/target of 110.85 (also the medium-term ascending trendline from 03 Jan 2019 flash crash low) as it printed a low of 111.02 in yesterday U.S. session.
- Short-term momentum has turned positive with the hourly RSI oscillator exited from its oversold region with a prior bullish divergence signal. Flip to a bullish bias for a further potential push up to retest the 112.10 range resistance.
- On the other hand, an hourly close below 110.85 sees a continuation of the slide towards the next support at 109.75.
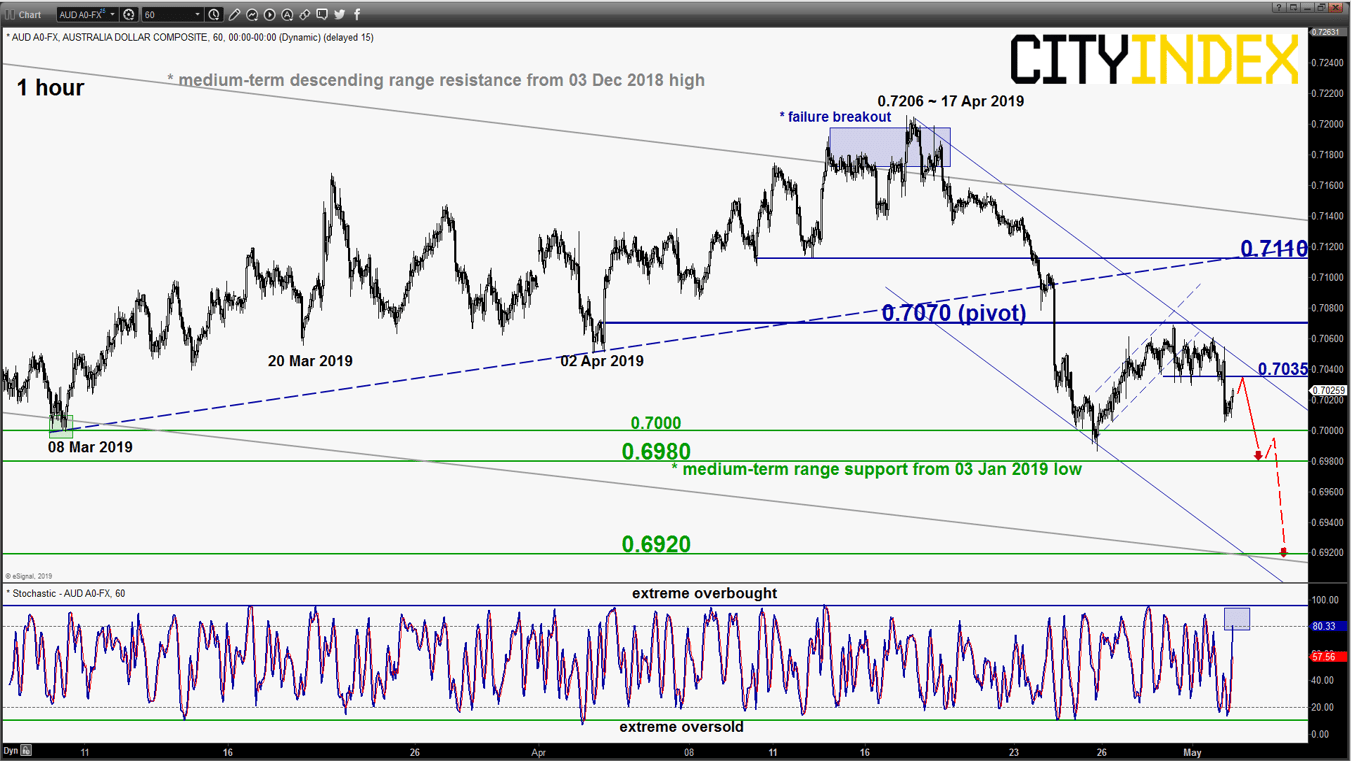
AUD/USD – Downleg in progess
click to enlarge chart
- Drifted down lower as expected from the 0.7070 key short-term pivotal resistance. No change, maintain bearish bias for a further potential push down to retest 0.6980 medium-term range support in place since 03 Jan 2019 low and a break below it opens up scope for a further downleg to target the next near-term support at 0.6920 (also the lower boundary of the minor descending channel from 17 Apr 2019 high & Fibonacci expansion).
- On the other hand, an hourly close above .7070 invalidates the bearish scenario for an extension of the corrective bounce towards the next intermediate resistance at 0.7110 (also the pull-back resistance of the former ascending support from 08 Mar 2019 low).
Charts are from eSignal
Latest market news
Yesterday 03:00 PM
Yesterday 01:12 PM
Yesterday 11:14 AM
Latest Forex articles
April 24, 2024 03:14 PM
April 24, 2024 11:00 AM
April 23, 2024 11:09 PM