


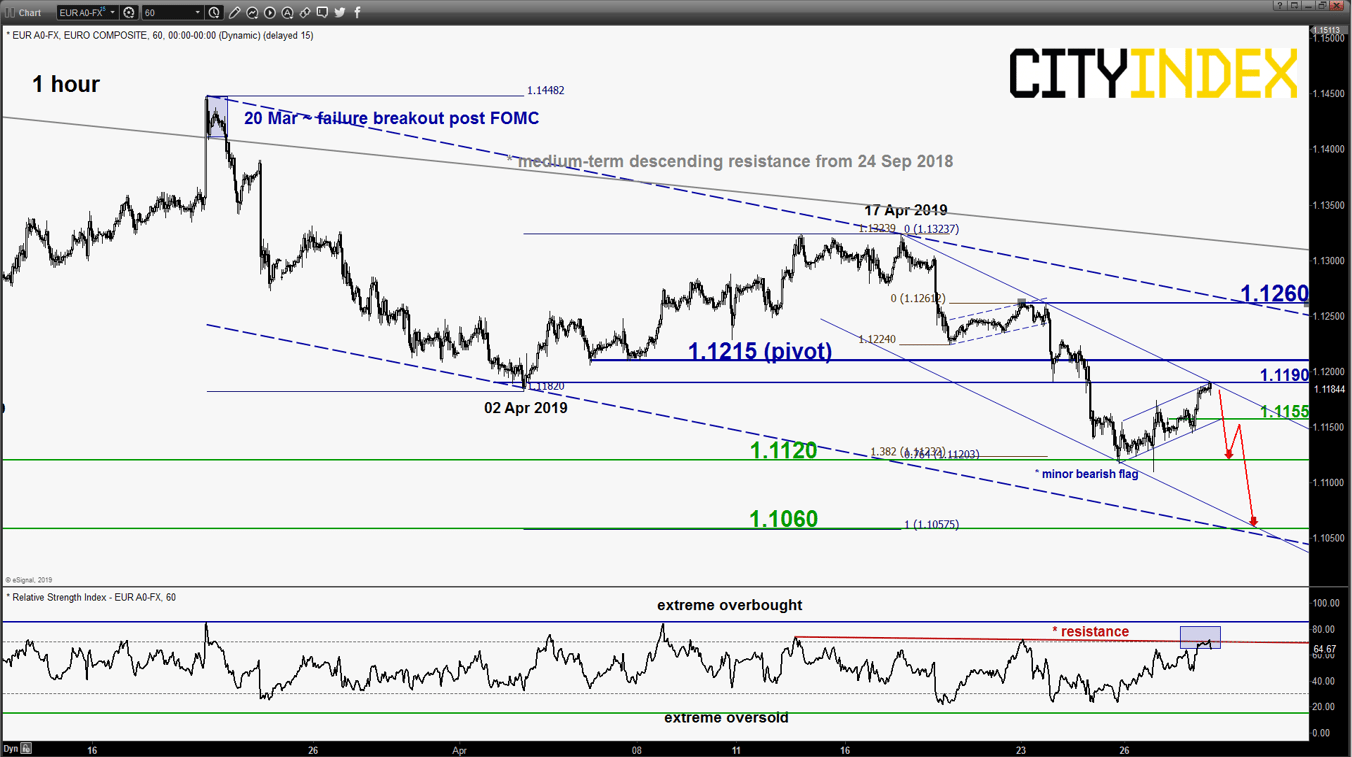
EUR/USD – Corrective bounce target met, downleg may resume
click to enlarge chart
- Bounced higher as expected since last Fri, 26 Apr Asian session and met the first resistance/target of 1.1180 as per highlighted in our previous report (click here for a recap). In today Asian session, it printed a current intraday high of 1.1191.
- Right now, it is coming close to a key inflection level of 1.1215 defined by the former medium-term range support from 12 Nov 2018, the minor descending channel resistance from 17 Apr 2019 and a Fibonacci retracement cluster coupled with the hourly RSI oscillator that has started to inch down from its overbought region/resistance and price action has started to evolve into a minor bearish flag since its 26 Apr 2019 low of 1.1110.
- Flip back to a bearish bias with 1.1215 as the key short-term pivotal resistance and a break below 1.1155 reinforces the start of another potential downleg to retest 1.1120 before targeting the next near-term support at 1.1060. However, an hourly close above 1.1215 invalidates the bearish scenario for an extension of the corrective bounce towards the next intermediate resistance at 1.1260.
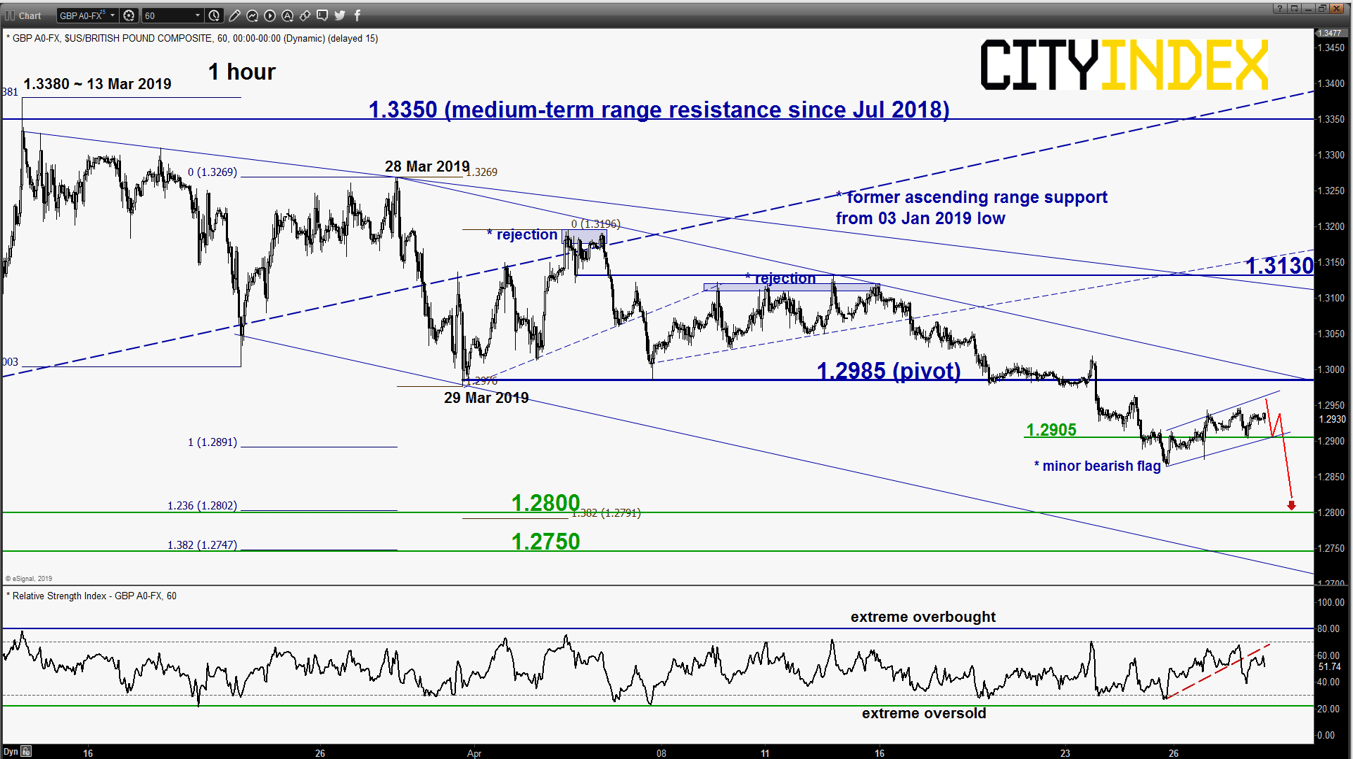
GBP/USD – 1.2985 remains the key short-term resistance to watch
click to enlarge chart
- Since its last Thurs, 25 Apr low of 1.2866, it has started to evolve into a minor bearish flag range configuration with its lower boundary now acting as a minor support at 12905. No change, maintain bearish bias with 1.2985 as the key short-term pivotal resistance and a break below 1.2905 reinforces the start of another potential donwleg to target the next near-term support at 1.2800 in the first step (61.8% Fibonacci retracement of 3-month up move from 03 Jan 2019 low to 13 Mar 2019 high, Fibonacci expansion cluster & 14 Feb 2019 swing low).
- However, an hourly close above 1.2985 negates the bearish tone for a squeeze up to retest the next intermediate resistance at 1.3130.
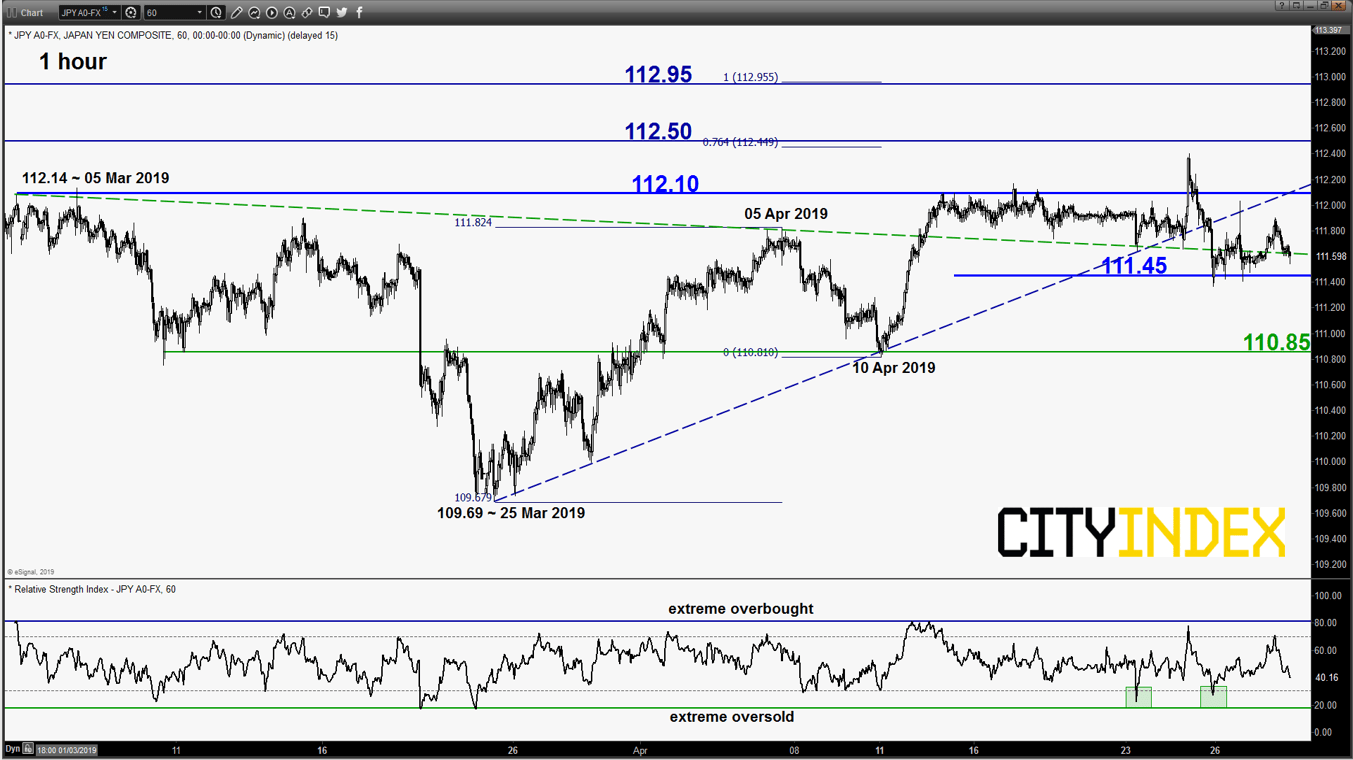
USD/JPY – Sideways
click to enlarge chart
- No change, maintain neutrality stance between 111.45 and 112.10. Only a break above 112.10 revives the bullish tone for a rally towards 112.50 and 112.95.
- On the flipside, a break below 111.45 sees a further slide towards the next support at 110.85.
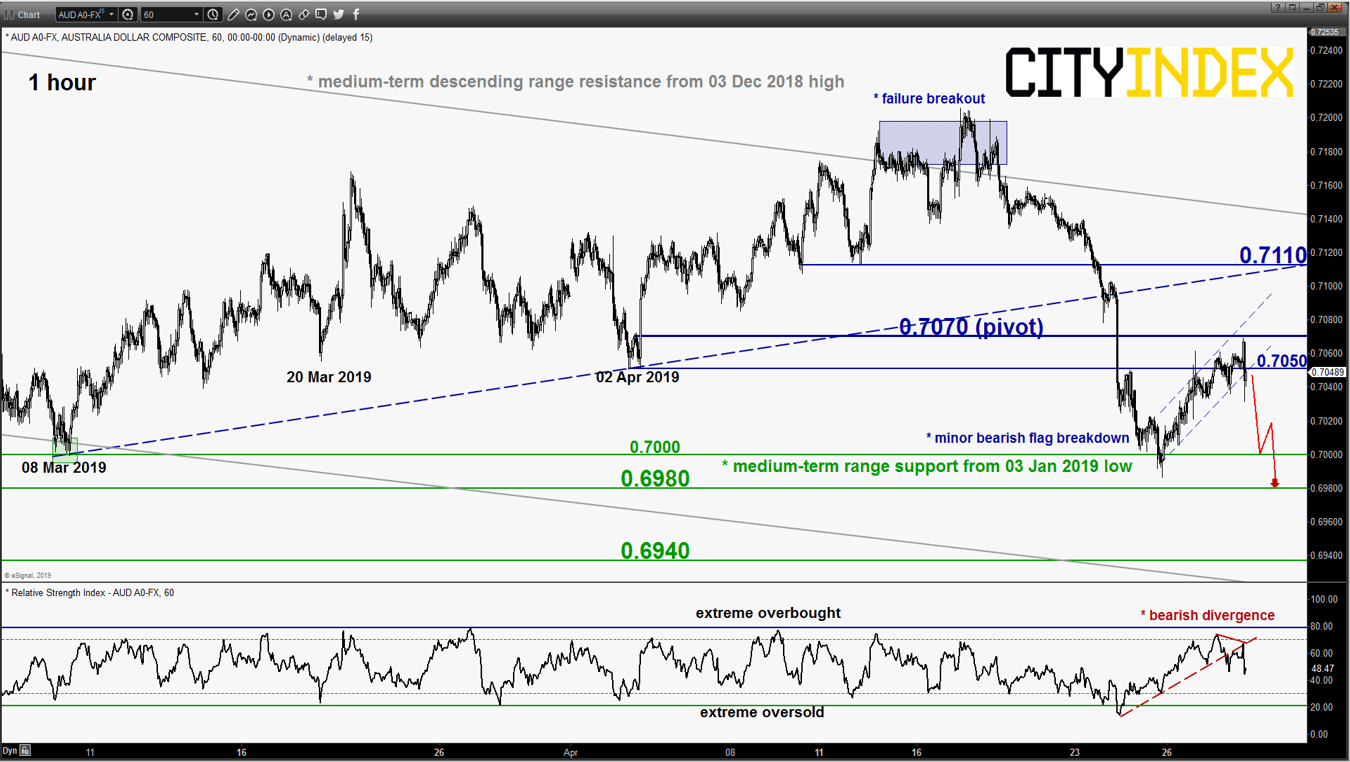
AUD/USD – Corrective bounce target met, downleg may resume
click to enlarge chart
- Bounced higher as expected and met the first resistance/target of 0.7055 as per highlighted in our previous report. Printed a current intraday high of 0.7069 in today’s Asian session. Thereafter, it reversed down and broke below the minor “bearish flag” range support at 0.7050 on the back of missed economic data estimates on China Apr official PMI numbers.
- Short-term momentum has turned negative with the 1-hour RSI oscillator that had broken below its significant ascending support with a prior bearish divergence signal. Flip back to a bearish bias with 0.7070 as the key short-term pivotal resistance for another potential downleg to retest the 0.6980 medium-term range support in place since 03 Jan 2019.
- However, an hourly close above 0.7070 invalidates the bearish scenario for an extension of the corrective bounce towards the next intermediate resistance at 0.7110 (also the pull-back resistance of the former ascending support from 08 Mar 2019 low).
Charts are from eSignal
Latest market news
Yesterday 01:23 PM
Yesterday 06:01 AM
April 18, 2024 11:27 PM
April 18, 2024 04:46 PM
Latest Forex articles
Yesterday 06:01 AM
April 17, 2024 02:40 PM
April 17, 2024 04:47 AM