


October 5, 2021 7:40 PM

While expectations were that OPEC would leave output at 400,000 bpd at their October meeting, its obvious from the reaction in the oil markets that many had hoped they would increase supply. After the announcement of “unchanged” from OPEC, oil markets gushed higher with WTI closing nearly +2.5% at 78.50 and Brent closing nearly +2.6% at 81.19.
What factors move the price of oil?
It’s no surprise inflation is on the rise with oil prices surging. For reference, WTI oil was up over 9.5% in September and after 2 days of trading, is up nearly 5.25% in October! Earlier, Tokyo released its CPI, which often acts a proxy for Japan as a whole. Tokyo’s September CPI YoY was +0.3% YoY vs -0.4% in August, a majority of which was due to higher energy and food prices. This was the first time the reading has been above 0% since July 2020. This has been seen across the globe, as inflation in Europe last week was shown to be 3.4% YoY vs 3% the previous month.
Where could it stop? The first resistance level is the 127.2% Fibonacci extension from the June 6th highs to the August 23rd lows. Above there is the 2013 low near 85.50 and then the 161.8% Fibonacci retracement from the same timeframe as above at 86.49. Notice that the RSI is in overbought territory, an indication that oil may be ready for a correction. First support is at prior highs of 77.07.
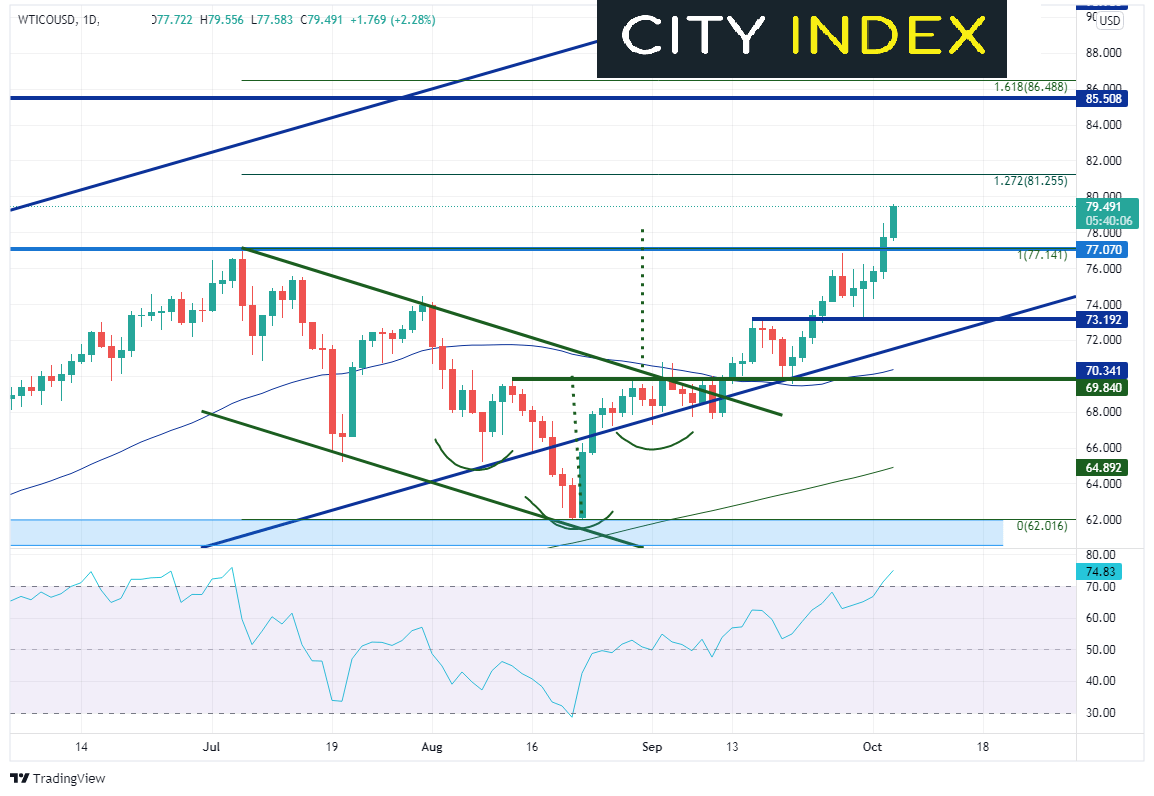
Source: Tradingview, Stone X
Brent Oil offers much of the same look as WTI as they are both trading at new highs for the year. However, unlike WTI, Brent traded to new highs at 86.61 in October 2018. Resistance in front of that level is at the 161.8% Fibonacci extension from the July 6th highs to the August 20th lows near 85.67. There is also an upward sloping trendline from April 2020 which crosses near those levels. If price breaks above the 161.8% Fibonacci level, there is room for it to run up to the November 2013 lows near 103.42! Notice that just as with WTI, the RSI is overbought, indicating Brent may be ready for a pullback. First support is at the highs from September 28th, near 80.06.
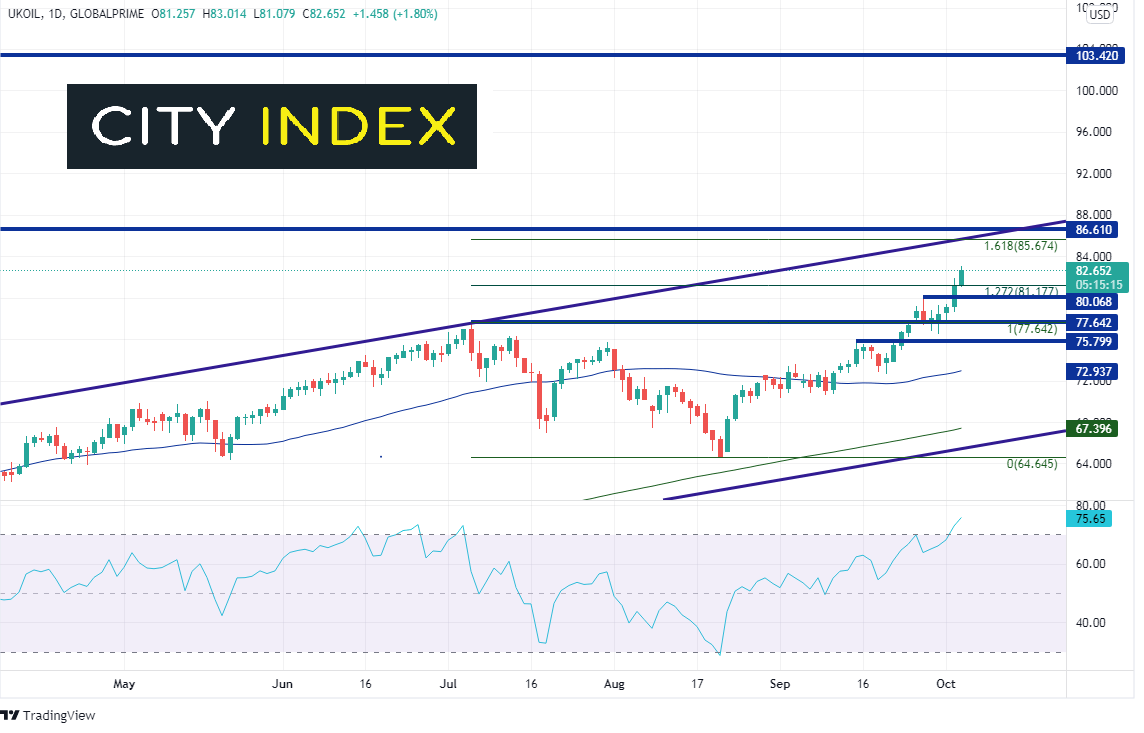
Source: Tradingview, Stone X
USD/CAD made a evening star candlestick formation from August 19th to August 23rd, which is a reversal formation. Indeed, price pulled back from a high of 1.2949 to 1.2493 on September 3rd at trendline support, extending back to July 5th. The pair bounced from there but failed to take out the highs of August 20th. This set up what was eventually a head and shoulders pattern, which broke the neckline yesterday near 1.2600. USD/CAD has been moving lower with Crude Oil for the last four days. The target for the head and shoulders pattern is the length from the head to the neckline, added to the breakdown of the neckline. For USD/CAD on the daily timeframe, this level is near 1.2295.
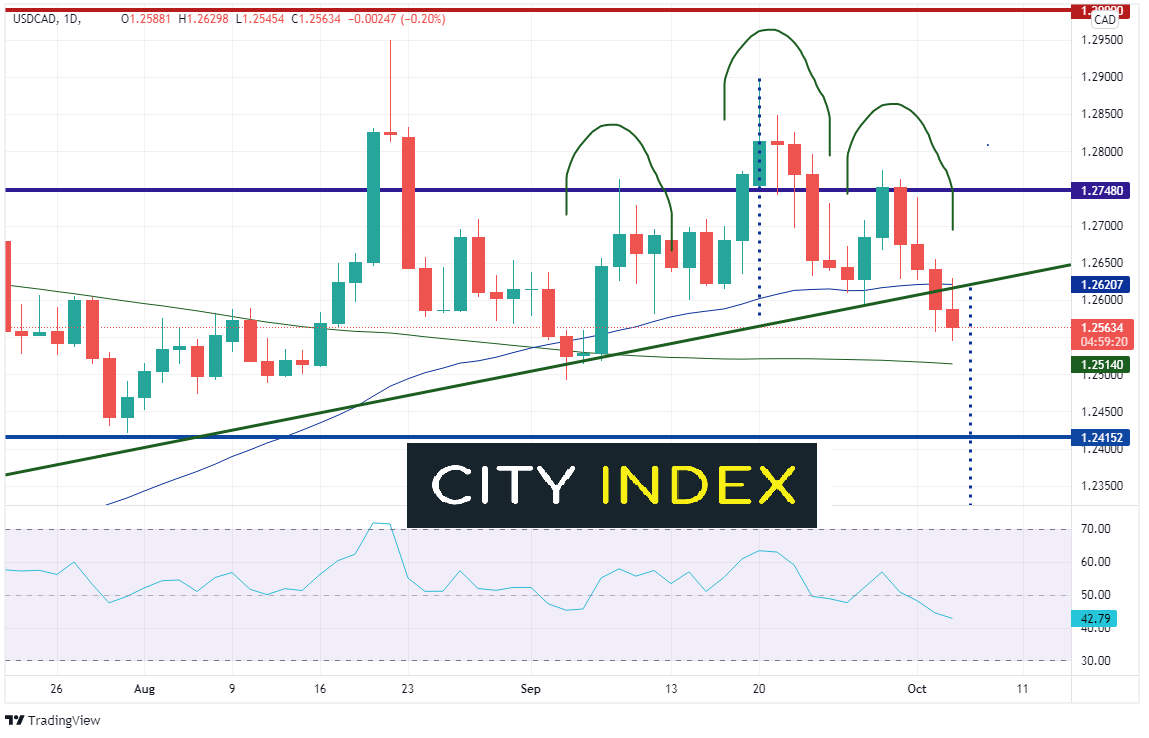
Source: Tradingview, Stone X
Trade USD/CAD now: Login or Open a new account!
• Open an account in the UK
• Open an account in Australia
• Open an account in Singapore
In addition to the head and shoulders pattern, we can see on the bottom of the chart that USD/CAD is highly correlated with WTI Crude Oil on a 240-minute frame. We consider a strong correlation coefficient anything above +0.80 or below -0.80. In this case the reading is -0.83, which means USD/CAD and WTI have a strong inverse correlation. Therefore, on a 240-minute timeframe, the two assets trade in opposite directions much of the time. Crude is currently in the middle of a band of support between roughly 1.2480 and 1.2592. Within that zone, the pair is testing a horizontal level at 1.2259. If price closes below, price could extend down to 1.2480. Below there, USD/CAD can fall all the way down to 1.2203 before reaching horizontal support. Given the directional correlation, if Crude Oil continues to move higher, USD/CAD should continue lower. However, if Crude prices are in for a correction, as the RSI suggests, near-term resistance is the 50 Day Moving Average at 1.2620 and at today’s highs of 1.2630.
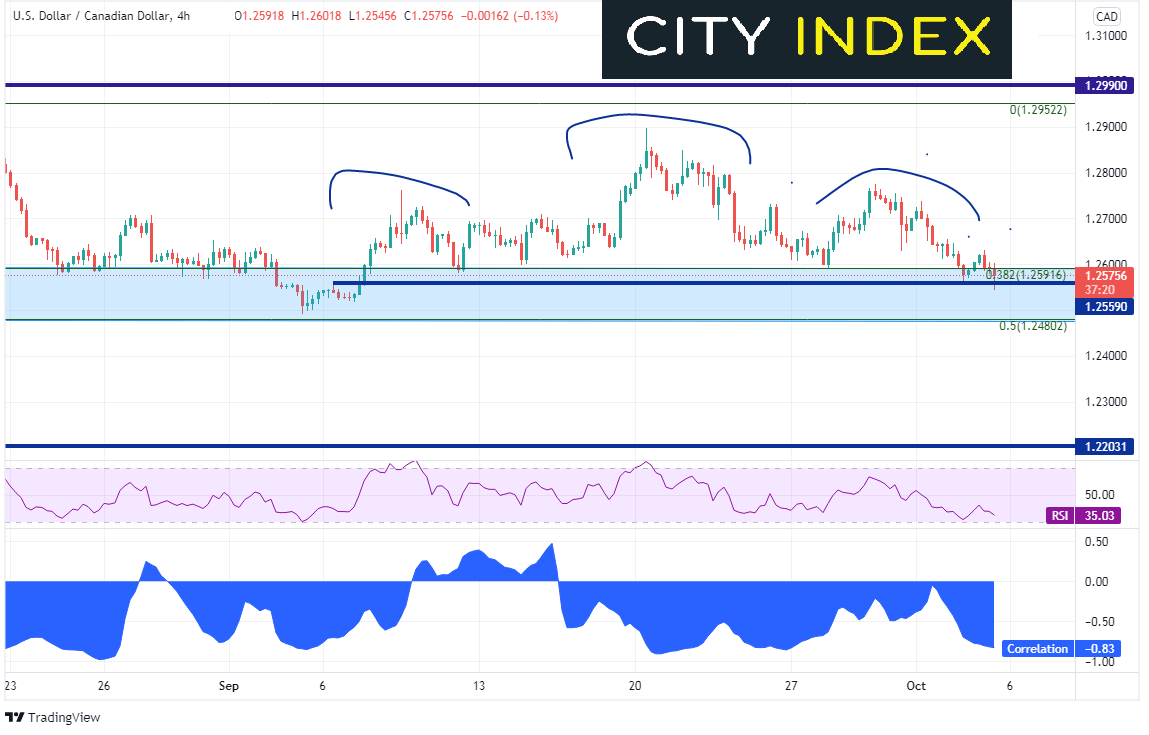
Source: Tradingview, Stone X
As demand for energy increases and OPEC supply remains constant, WTI and Brent oil prices should continue to increase. If that occurs, the correlation between USD/CAD and oil should continue to move higher as well. However, watch for a near-term correction as the RSI is in overbought territory. With continued demand, bulls will be taking advantage of any chances they have to buy dips, which means USD/CAD should be offered on bounces!
Learn more about forex trading opportunities.
Latest market news
Yesterday 01:32 PM
Yesterday 09:35 AM
Yesterday 07:23 AM
Yesterday 04:48 AM
Yesterday 12:17 AM
July 25, 2024 10:39 PM
Latest Trade Ideas articles

Yesterday 09:35 AM

Yesterday 12:17 AM

July 25, 2024 10:39 PM

July 25, 2024 05:30 PM