


Over the past week we have seen some large gyrations in the bond markets stemming from fears of systematic risks in the financial system. And with that has come large swings in sentiment and other asset classes. This makes it more of a trader’s market and an investors nightmare, which means speculators need to keep a close eye on headlines, as they shift sentiment one way or another.
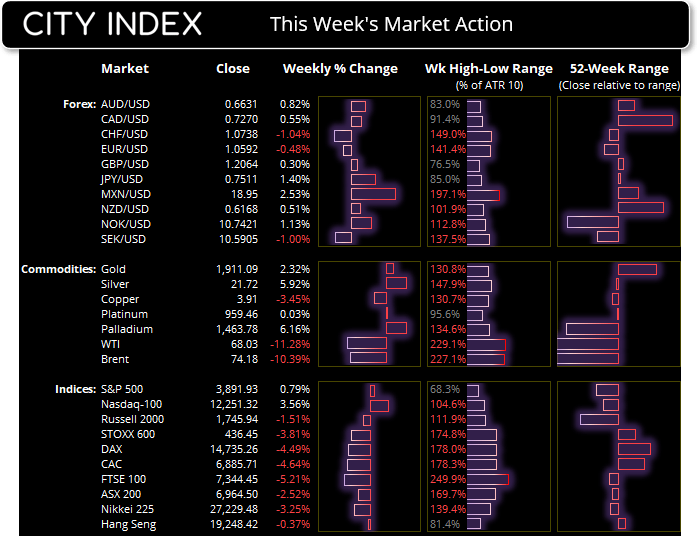
To give an idea of volatility levels, the majority of major indices and commodity markets have exceeded their average true ranges (with two trading days left to the week). And the majority of this volatility arrived on Monday.
Why are the markets so volatile at present?
Of course, the original trigger was the implosion of Silicon Valley Bank (SVB), which caused widespread fear of contagion and systematic risks for the financial system. And even though the Fed, US Treasury Department and Federal Deposit Insurance Corporation guaranteed deposits of the failed banks around market open this week, it actually caused more panic as markets took it as a sign things were really bad, and the ripple effect across global markets continued.
Since then, Credit Suisse has dominated headlines due to ‘material weakness’ in its financial reporting, the refusal of its largest backer to provide liquidity - and the Swiss National Bank’s (SNB) need to provide $50 billion of liquidity for the bank to meet its financial obligations.
- The Swiss franc has moved 1.5x more than its usual weekly range thanks to a combination of risk-off flows and news that the Swiss National Bank (SNB) need to provide liquidity to Credit Suisse to prevent them from imploding
- Implied volatility for interest rates rose to a 13-year high
- The DAX has endured its two worst days of the year this week, the SMI (Swiss Market Index) hit its lowest level since October
- Oil markets have broken major support levels and plunged to 15-month lows, European banks have led bourses lower
- Gold rallied over 7% in just five days
- Fears of systematic risks saw bond yields plunge (and bond prices rise) as traders bet central banks will now have to cut rates
- But then also question whether central banks could cut rates given the high levels of inflation
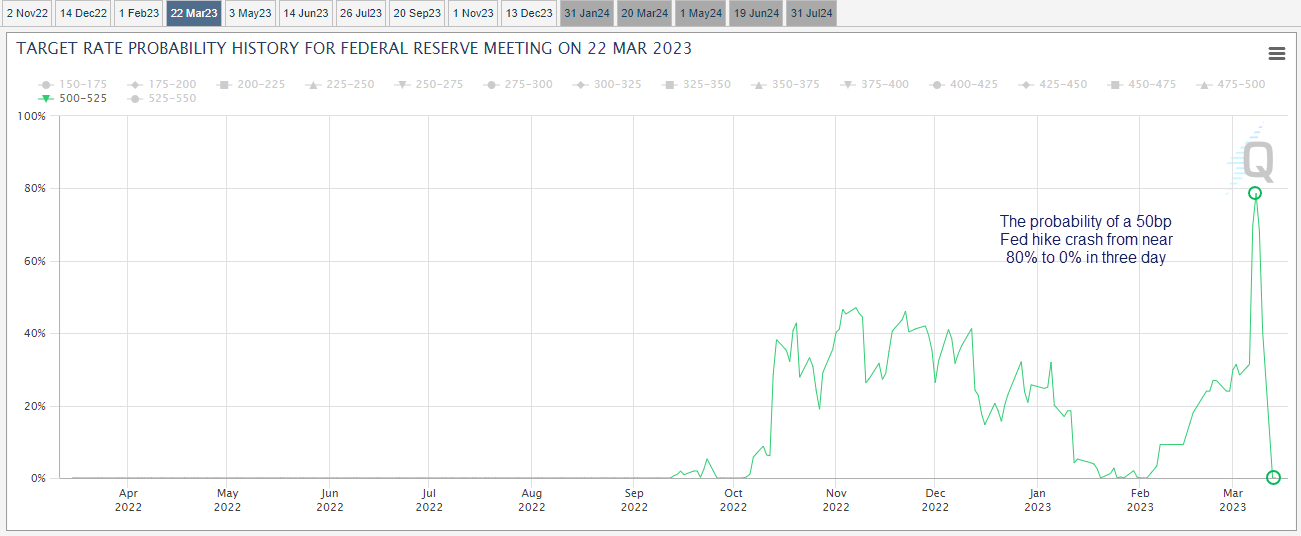
- Bets that the Fed will hike by 50bp have crashed from ~80% probability to 0% since last week, and now sentiment is meandering around a pause or a 25bp hike
- This has whipped the US dollar around like a dog chew in a dog’s mouth
- Risk pairs such as AUD, NZD, GBP have also been thrown around as sentiment flipped between risk-on and risk-off
How does a trader approach volatile markets?
Levels of volatility are rarely constant, as they tend do oscillate between low levels of volatility to high (and back). But when volatility gets high, so can correlations. For example, gold has performed a strong rally whilst US yields and the US dollar dropped (and visa versa).
A basic rule of thumb is that we could expect trends to develop and last longer during lower levels of volatility, whist high levels of volatility can see markets move very quick in one direction or another, but over a short period of time.
Therefore, a potential way to manage this is to switch timeframes. If volatility is low, traders may stand a better chance of catching moves on the daily chart or above, but during times of turmoil they may wish to trade intraday timeframes, not hold positions overnight and be prepared to change direction quickly. Or simply step aside.
AUD/USD 1-hour chart:
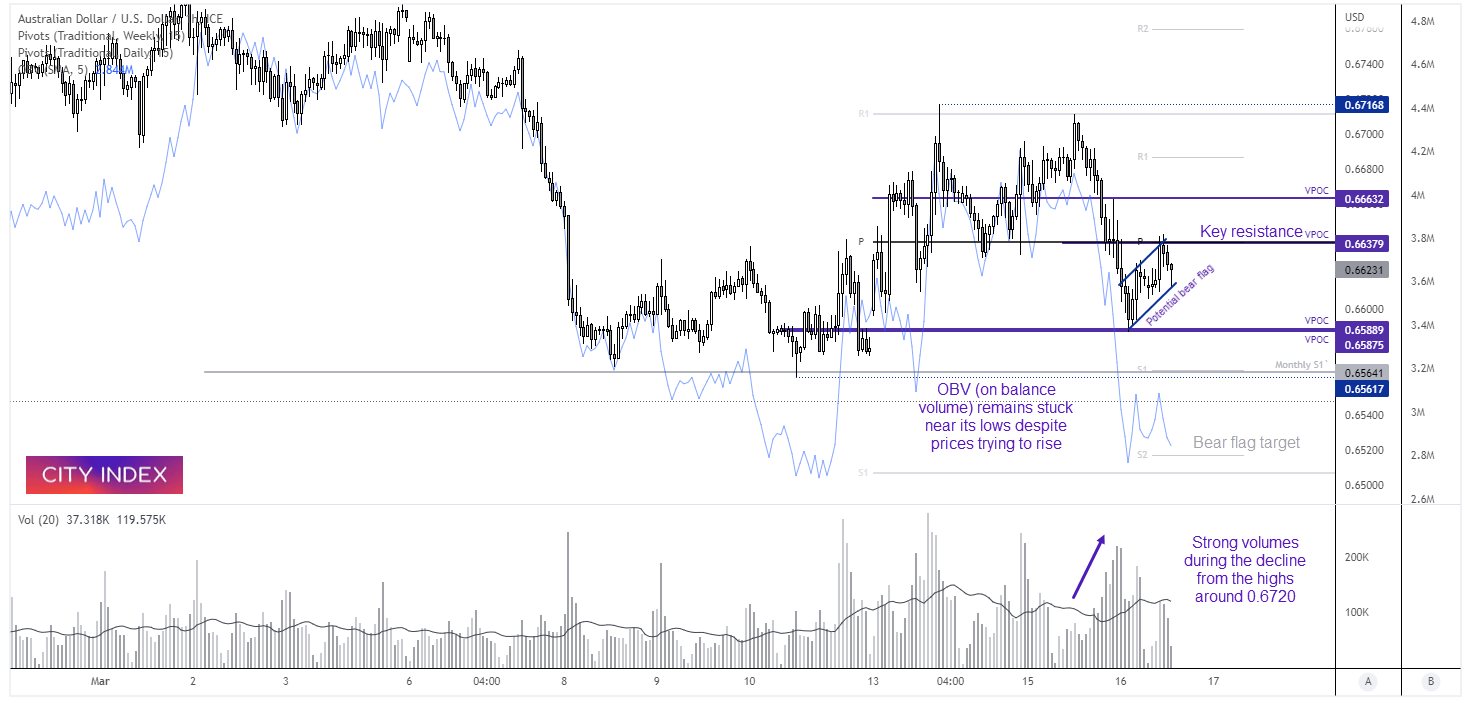
As an example, we can argue what the trend is on this chart – but if markets are driven by headlines through fear it is sometimes best to focus on the key levels and attempt to trade around them. We know that the 0.6638 area is an important level as the market tested it earlier today (thanks to a strong Australian employment report) but then pulled back. And we knew this area was important in advance, as it marks the daily and weekly pivot point. Moreover, it was yesterday’s VPOC (volume point of control) which displays the most traded prices of yesterday.
If we see prices test but fail at that level again, it could entice bears back to the table and for a move towards the 0.6600 – 0.6587 are (where there are two more VPOC’s). Whilst a break above today’s high could send prices towards the 0.6663 VPOC.
If we had to pick an overall direction, we could assume bears may have the upper hand as the OBV (on balance volume) indicator remains stuck near its lows despite prices remaining elevated. And that suggests bearish volume remains dominant. Furthermore, strong volume accompanied the decline from the highs around 0.6720, yet volumes during today’s small ‘rally’ are very thin. And finally a potential bear flag is forming which projects a target around the daily S2 pivot.
-- Written by Matt Simpson
Follow Matt on Twitter @cLeverEdge
How to trade with City Index
You can trade with City Index by following these four easy steps:
-
Open an account, or log in if you’re already a customer
• Open an account in the UK
• Open an account in Australia
• Open an account in Singapore
- Search for the market you want to trade in our award-winning platform
- Choose your position and size, and your stop and limit levels
- Place the trade
Latest market news
Yesterday 01:32 PM
Yesterday 09:35 AM
Yesterday 07:23 AM
Yesterday 04:48 AM
Yesterday 12:17 AM
July 25, 2024 10:39 PM
Latest Trade Ideas articles

Yesterday 09:35 AM

Yesterday 12:17 AM

July 25, 2024 10:39 PM

July 25, 2024 05:30 PM