


Due to its popularity and the significant weighting of the stocks in the index, the trading volume is high. Therefore, the trading conditions, including the consistently tight spreads, can be favourable for traders.
Clicking on the links below will take you to the specific sections of this comprehensive index overview.
- What is the ASX 200 equity index?
- Companies in the S&P (Standard & Poor’s) ASX 200
- Key ASX 200 metrics: the highs, lows and returns
- How to trade the ASX 200
- What moves the ASX 200?
What is the ASX 200 equity index?
The ASX 200 is the overall benchmark for the Australian equity markets’ performance, and is often referred to as the Australia 200 or Aussie 200. The index tracks the 200 largest ASX listed stocks by market cap, which account for roughly 82% of Australia’s share market capitalisation.
The S&P/ASX 200 index is a market-capitalisation weighted index, but it’s also float-adjusted. So, the index’s total contribution is compared to the stock’s value when the company initially floated.
The companies in the ASX 200 index must be listed on the ASX. Both common stock and preferred stock can be included. Companies are also eligible that have primary listings on another exchange or are located in another country.
The ASX 200 index is maintained by the American credit rating firm Standard & Poor’s, a leading equity index provider and respected data source of independent credit ratings. S&P describes the S&P/ASX 200 as the ‘preeminent Australian benchmark because it is representative, liquid, and tradable’.
The ASX 200 gets rebalanced every quarter by the five-panel Index Committee to ensure the stocks meet the qualifying criteria. The index’s main trading hours are between 10:00-16:00 (GMT+10:00) five days a week.
Want to trade indices? Open an account today or practise trading in a demo account.
What are the ASX 200 companies?
Companies are categorised in the ASX classed by their primary business activity and according to the Global Industry Classification Standard (GICS). Most established markets use GICS, so it’s easy to compare Australian sectors and industries’ performance with those of other countries.
Unlike the ASX 50 index of the top 50 companies listed on the exchange, the ASX 200 is regarded as a broader indication of Australian market sentiment.
However, the top fifty quoted companies in the ASX 200 still account for approximately 75% of the index’s market capitalisation, with the top ten firms accounting for 40% of the total market cap.
The two largest companies in the ASX 200 are materials and aggregates firms. Rio Tinto is number one with a market cap of approximately $172.4b and BHP second at $167.5b.
Banks then occupy five places out of the top ten, in order of market cap as of April 12, 2021, they are Commonwealth Bank of Australia, Westpac, National Australian Bank, ANZ, and Macquarie.
ASX 200 sectors as % of total assets:
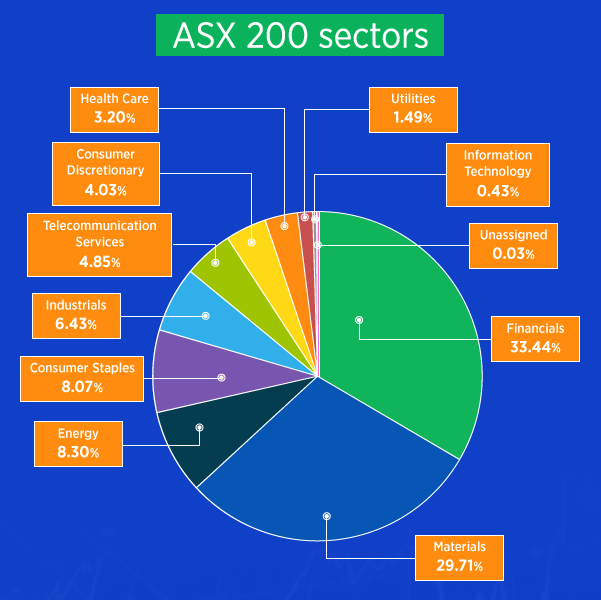
- Financials 33.44%
- Materials 29.71%
- Energy 8.30%
- Consumer Staples 8.07%
- Industrials 6.43%
- Telecommunication Services 4.85%
- Consumer Discretionary 4.03%
- Health Care 3.20%
- Utilities 1.49%
- Information Technology 0.43%
- Unassigned 0.03%
Key ASX 200 metrics: the highs, lows and returns
- The index launched in April 2000, with a starting index value of 3133.3 – equal to the broader All Ordinaries Index value
- Despite a total of 200 quoted firms, the index is dominated by large companies
- In 2020, ten stocks in the index accounted for over 44% of the index
- Five of the top ten stocks are banking groups
- Financial firms account for close to a third of the index
- Materials are the second-largest sector on the index at close to 30%
- The index fell to its all-time low of 2,753 on February 3, 2003
- The index printed 6000 for the first time on February 15, 2007
- The ASX 200 crossed the 7000 points level for the first time on January 16, 2020
- The index reached an all-time high of 7199.79 in February of 2020
- The ASX 200 fell to a multi-year low of 4534 on March 23, 2020, as global pandemic fears hit market sentiment
- The market capitalisation as of April 12, 2021, was $2.23 trillion
- The annual return up to April 12, 2021, was 34.185%
- The P/E ratio as of April 12, 2021, was 58.537
How to trade the ASX 200
The ASX 200 Index is an excellent method to trade the Australian stock market without analysing individual company performance.
One of the most popular ways to invest in the ASX 200 is through contracts for difference (CFDs).
When you trade the index using CFDs, you speculate on the direction of the underlying asset’s prices without owning it. Trading ASX 200 CFDs allows you to buy or sell the index in either market direction.
Whether you expect an asset’s price to rise or fall, you can hold long or short positions. CFDs allow you to profit from both bullish and bearish price movements in the index.
When you trade ASX 200 CFDs, you’ll be using leverage, which means you can open your position for a fraction of the full cost. This can magnify both profits and losses.
The ASX 200 Index is liquid, and the volatility is consistently high. Therefore, the spreads can be comparable to other equity indices such as the Dow Jones 30 and UK FTSE 100.
When you trade the ASX 200 with us, you’ll get the choice between cash indices, and futures prices. Let’s look at each in more detail.
ASX 200 cash index
When you trade a cash index, you deal at the current price of the ASX 200, referred to as the cash or spot price.
Cash indices are popular with traders because they typically provide some of the tightest spreads in an index, but you could get charged holdover costs if you keep the position open overnight.
ASX 200 index futures
With index futures means you agree to trade the ASX 200 at a set price, at a predetermined future date. For traders with a long-term outlook, index futures are popular because the overnight funding charges are in the spread.
What moves the ASX 200?
- Macroeconomic events: global economic events such as the USA’s trade tariffs on China and the coronavirus pandemic affected the ASX 200. An index dominated by financials and materials (banks and miners) will be highly susceptible to global commerce changes, and China is (by some distance) Australia’s biggest customer
- News reports: on your economic calendar, you’ll see medium to high impact events listed that can affect the Australian dollar’s price, and many of these events can affect the ASX 200. Jobs reports, GDP (Gross Domestic Product) data, export and import metrics can all affect the index’s price
- Interest rate decisions: the Reserve Bank of Australia’s (RBA) monetary policy decisions can cause movements in the ASX 200. If interest rates go up, firms can’t borrow to buy or invest as cheaply, so their share price could fall
- AUD strength: Australian dollar strength can affect the price of the ASX 200. There are direct positive correlations between AUD versus its peers and the ASX 200. If mining and financial firms do well, the Aussie dollar is in demand to handle international business. Therefore, it tends to rise in tandem with the index
- Earnings reports: the earnings reports of individual companies on the ASX 200 can significantly affect the price of the index. Because it’s a market-capitalisation weighted index, earnings reports of companies with larger market caps usually have the most significant impact on price
- Price of commodities: The strength of AUD is causally linked to the volume of Australia’s exports. If Australian mining commodities such as iron ore and coal are in high demand and rising in price, then AUD generally increases too. Tradable commodities such as gold and copper follow similar patterns
Want to trade indices? Open an account today or practise trading in a demo account.
Latest market news
Yesterday 01:32 PM
Yesterday 09:35 AM
Yesterday 07:23 AM
Yesterday 04:48 AM
Yesterday 12:17 AM
July 25, 2024 10:39 PM
Latest ASX articles

July 25, 2024 01:01 AM

July 22, 2024 10:43 PM

July 18, 2024 11:14 PM

July 10, 2024 11:01 PM