


S&P 500 – Imminent potential corrective rebound before new down move
click to enlarge charts
Key Levels (1 to 3 weeks)
Intermediate resistance: 2770
Pivot (key resistance): 2802
Supports: 2700 & 2630
Next resistance: 2959 & 3007
Medium-term (1 to 3 weeks) Outlook
Last week, the SP 500 Index (proxy for the S&P 500 futures) had staged the expected decline and hit the medium-term target/support of 2730 as per highlighted in our previous report (click here for a recap). In today, 03 Jun Asian session, it has gapped down from last Fri, 03 Jun U.S. close of 2751 and printed a current intraday low of 2732. Technical elements remain bearish as follow;
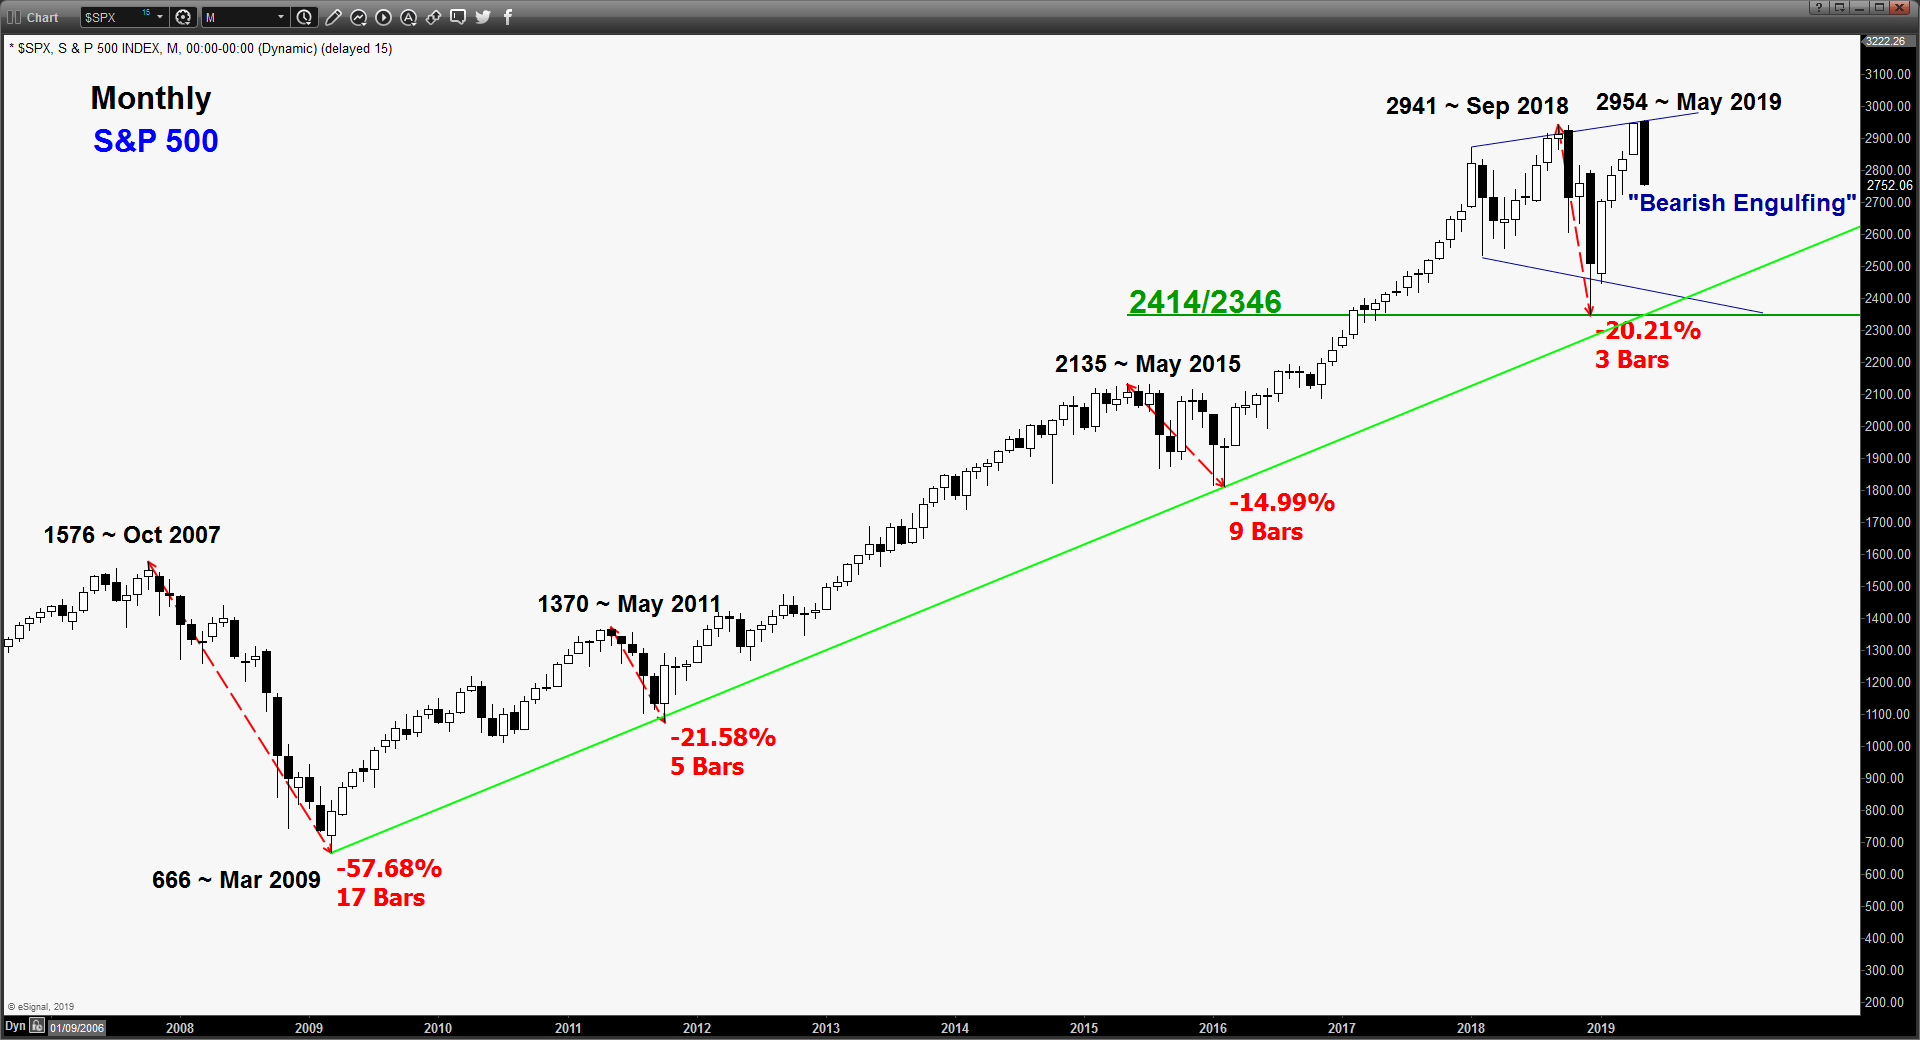
- Ended May 2019 with a monthly “Bearish Engulfing” candlestick pattern that recorded a monthly loss of -6.8%, its worst monthly performance since Jan 2019 and ended its prior 4-month of higher consecutive monthly closes.
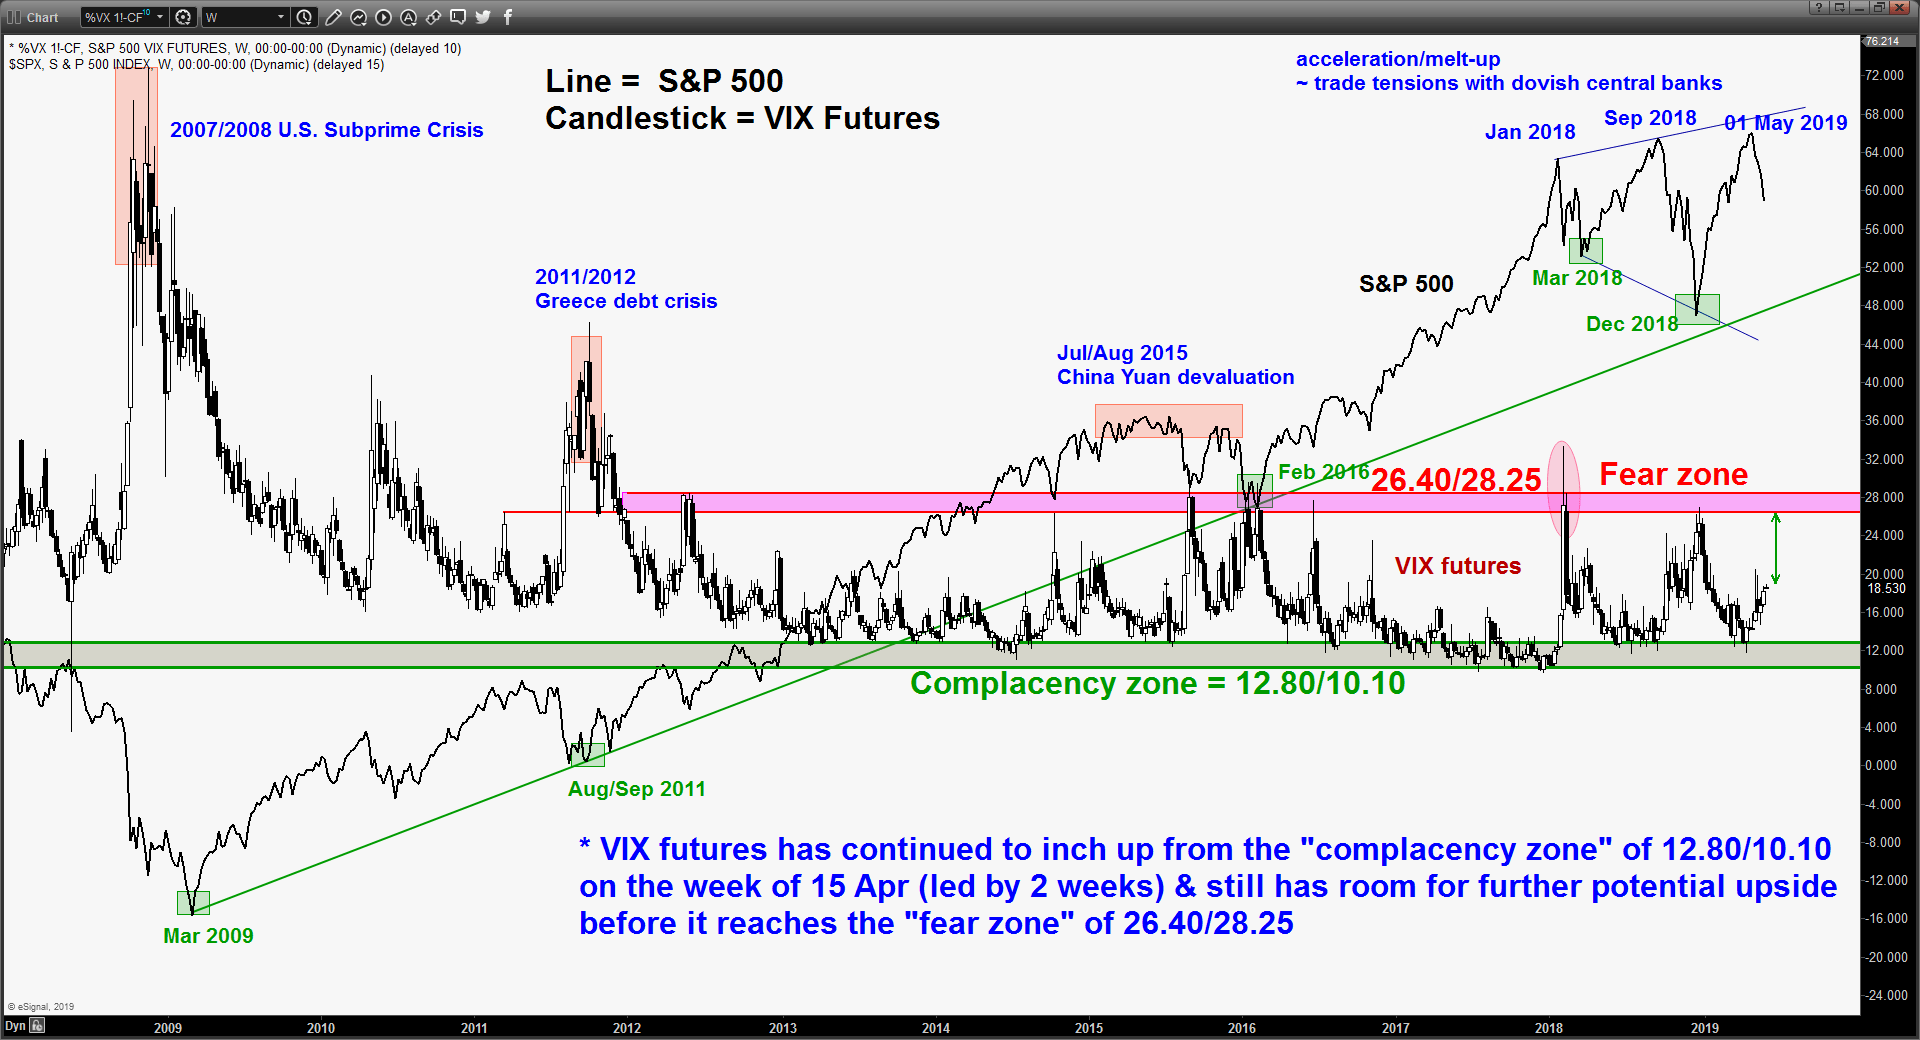
- The VIX futures has continued to rally and still shows further upside potential before it reaches a significant “fear zone” of 26.40/28.25 where past bearish price action of Index tends to see bullish reversal.
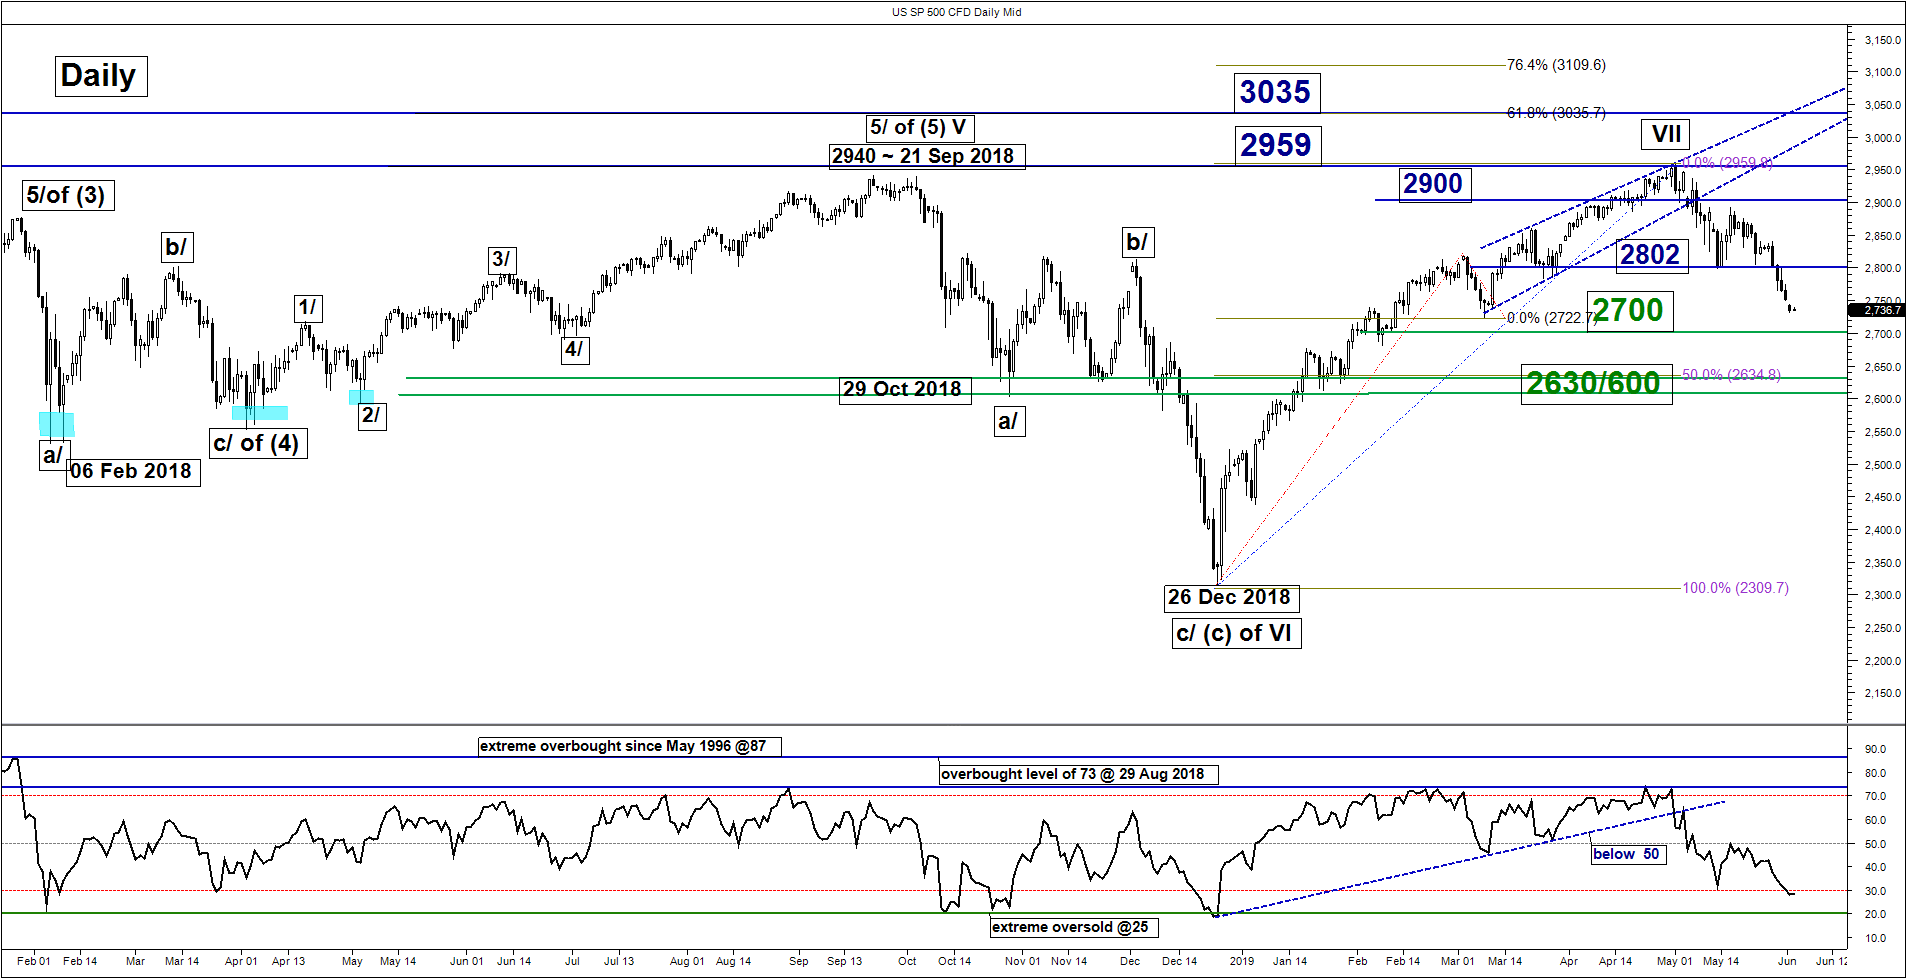
- Since its current all-time high seen on 01 May 2019, the Index has evolved into a medium-term descending channel with its lower boundary coming to act as a support at 2700.
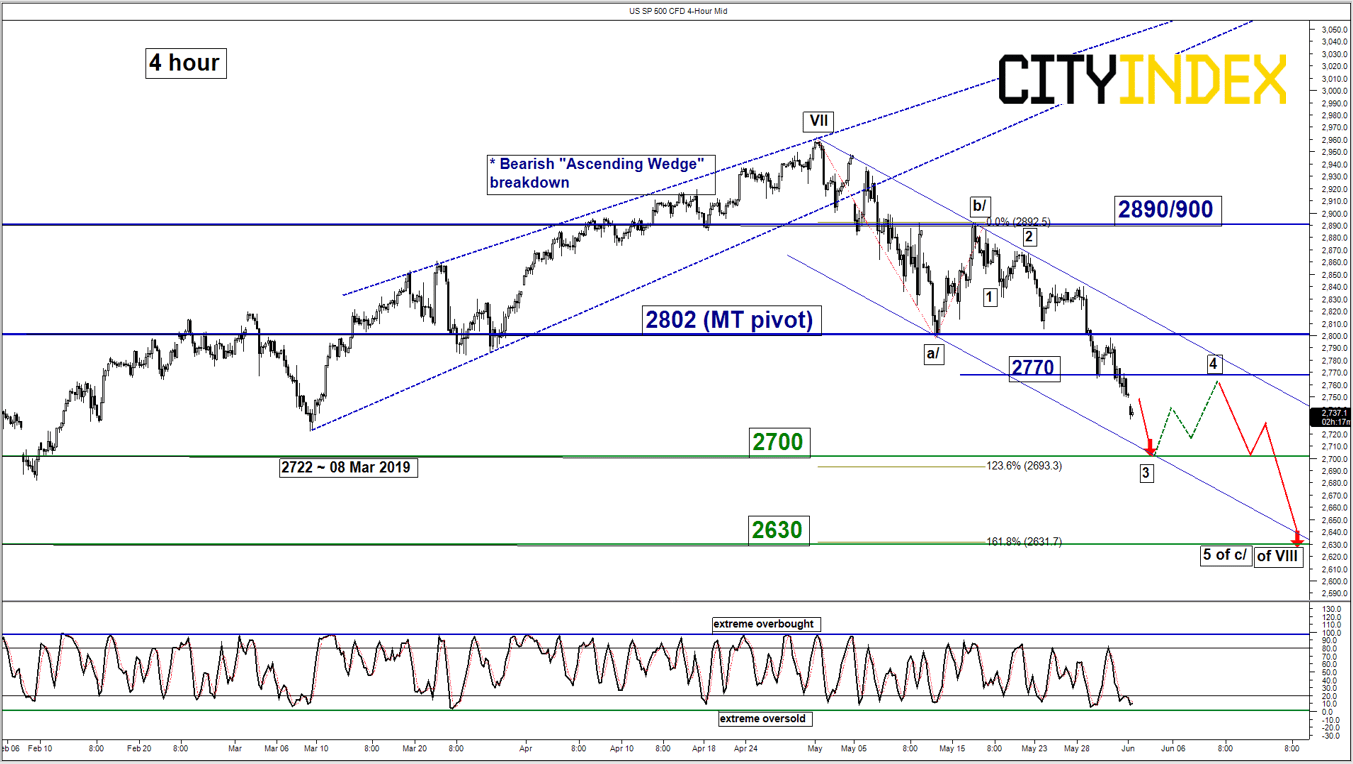
- The 2700 descending channel support coincides with a Fibonacci retracement/expansion cluster and in conjunction with Elliot Wave/fractal analysis highlights the risk of a corrective rebound at 2700. Price action is likely to be shaping the final potential impulsive downleg to complete the impulsive minor degree impulsive down move wave 3 sequence that has started from 2890 high of 16 May 2019 (see 4-hour chart).
- In addition, the 4-hour Stochastic oscillator has now almost reached an extreme oversold level of 3 which reinforces the imminent minor corrective rebound scenario.
- The key medium-term resistance stands at 2802 which is also defined by the former swing low of 13 May 2019 and the upper boundary of the descending channel.
Therefore, we maintain the bearish bias in the medium-term (1 to 3 weeks) but cautious of an imminent minor corrective rebound to take place around the 2700 level with a maximum bounce limit set at the 2802 key medium-term pivotal resistance before another potential impulsive down move sequence materialises to target the next support at 2630.
On the other hand, a clearance with a daily close above 2802 invalidates the bearish scenario for a squeeze up towards the next resistance at 2890/900.
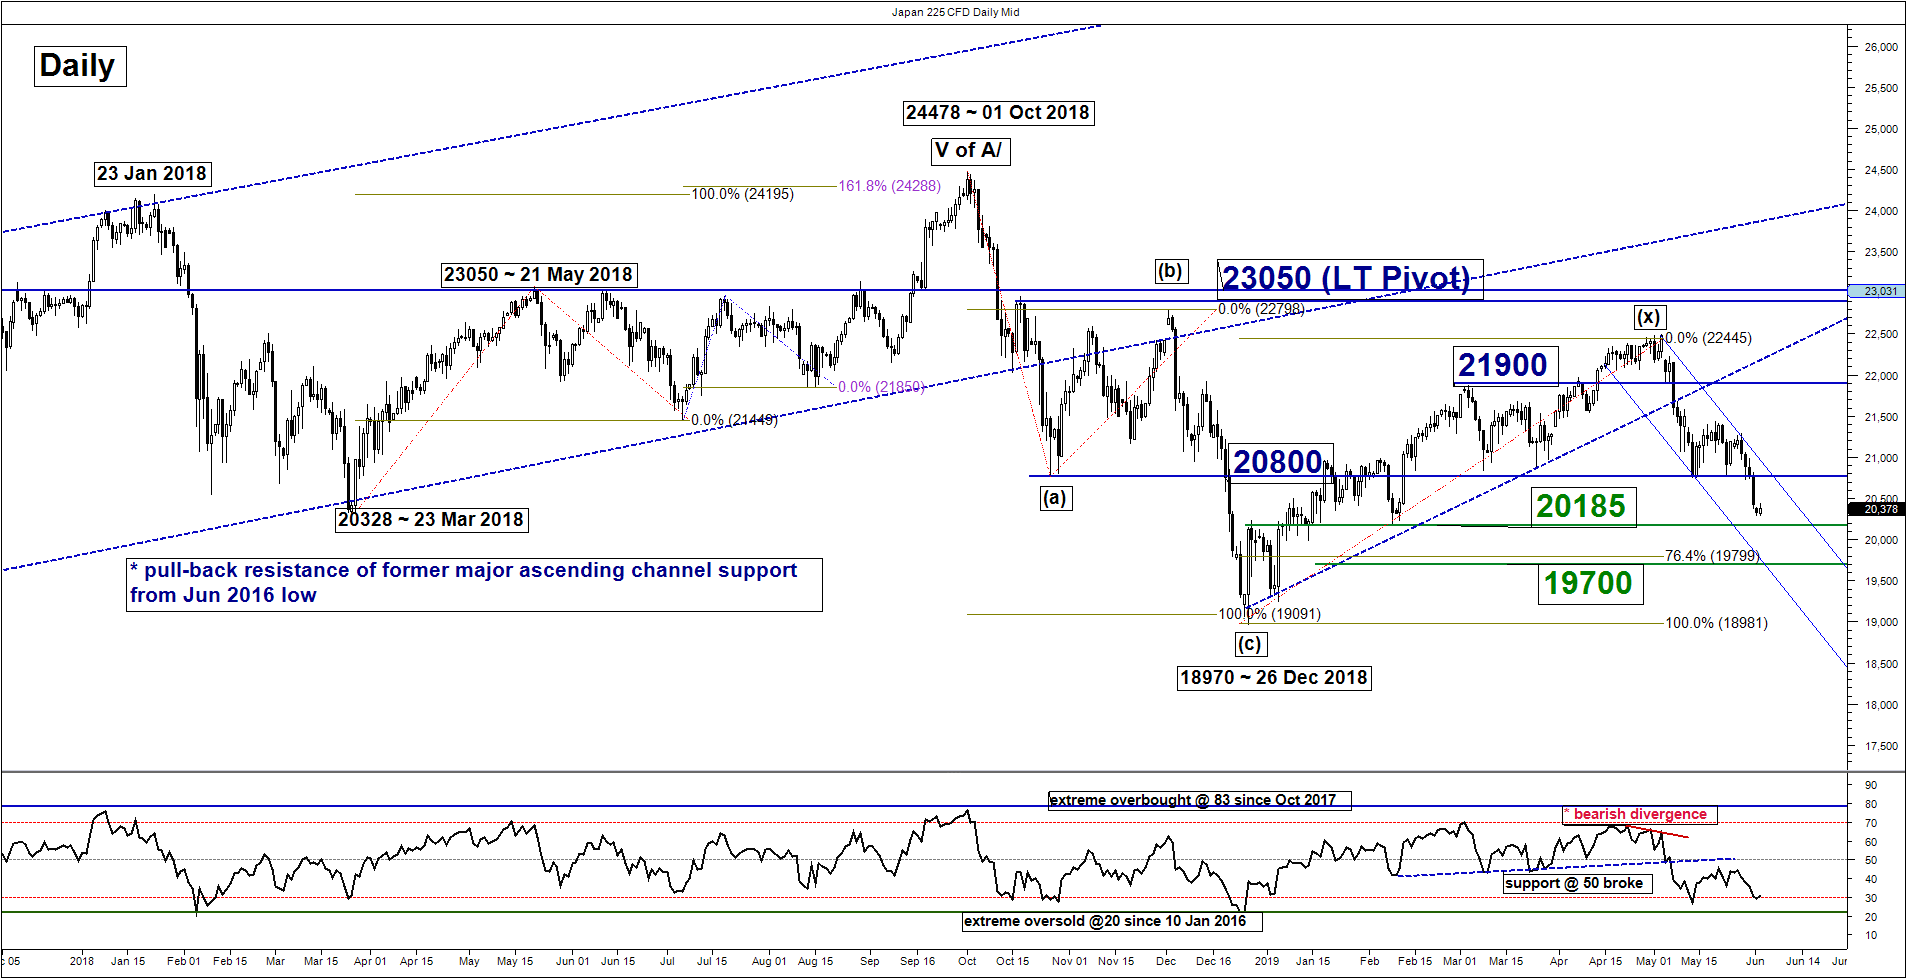
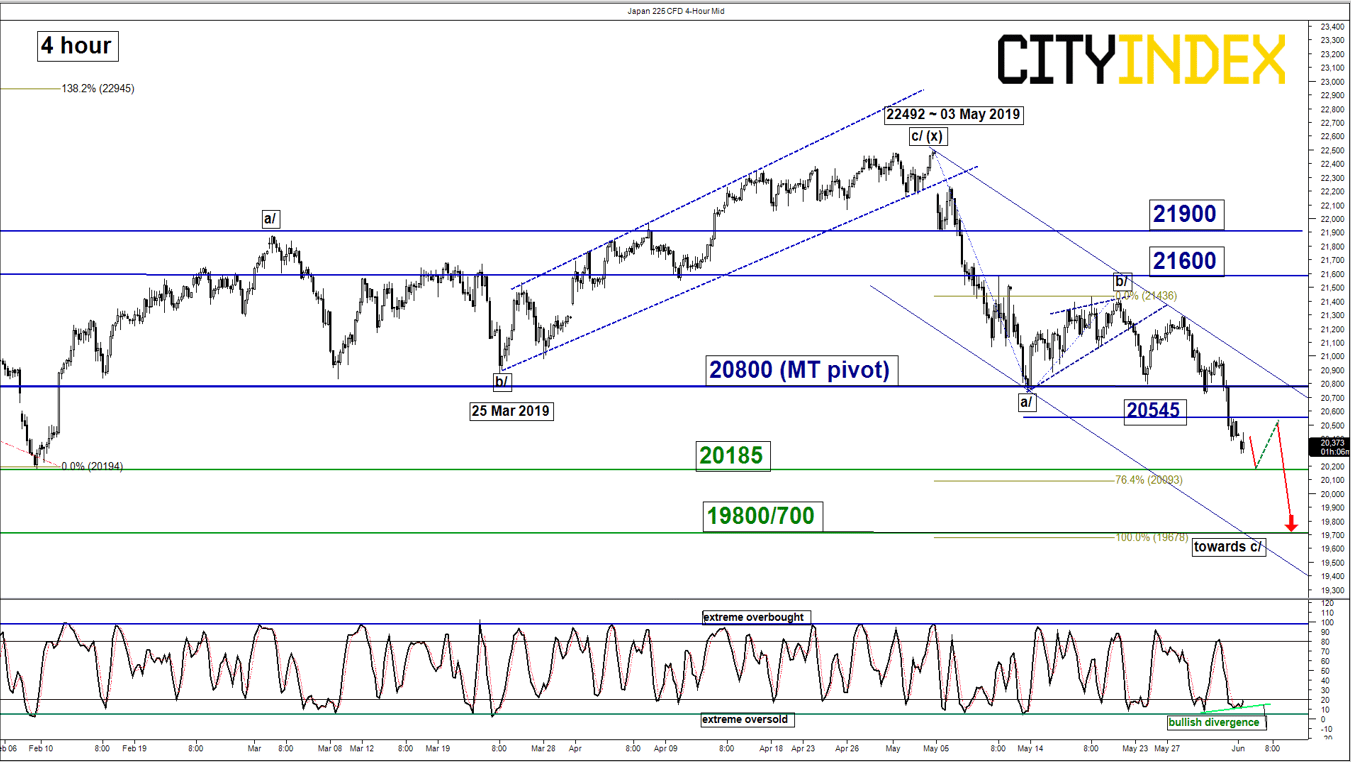
Nikkei 225 – Risk of minor corrective rebound before new down move
click to enlarge charts
Key Levels (1 to 3 weeks)
Intermediate resistance: 20545
Pivot (key resistance): 20800
Supports: 20185 & 19800/700
Next resistances: 21600 & 21900
Medium-term (1 to 3 weeks) Outlook
Last week, the Japan 225 Index (proxy for the Nikkei 225 futures) had staged the expected bearish breakdown below 20800 and dropped towards the medium-term target/support of 20185 as per highlighted in our previous report.
In today, 03 Jun Asian session, it has printed a current intraday low of 20291 (just 0.5% away from 20185) with risk of an imminent corrective rebound within a medium-term downtrend as advocated by Elliot Wave/fractal analysis. In addition, the 4-hour Stochastic oscillator has shaped a bullish divergence signal at its oversold region which indicates a slowdown on its current downside momentum of price action.
We maintain the medium-term (1 to 3 weeks) bearish bias but cautious of a minor rebound to take shape above 20185 towards 20545 with a maximum limit set at the tightened key medium-term pivotal resistance now at 20800 before another potential downleg materialises to target the next support at 19800/700.
On the other hand, a clearance with a daily close above 20800 invalidates the bearish scenario for an extension of the corrective rebound towards the next resistance at 21600.
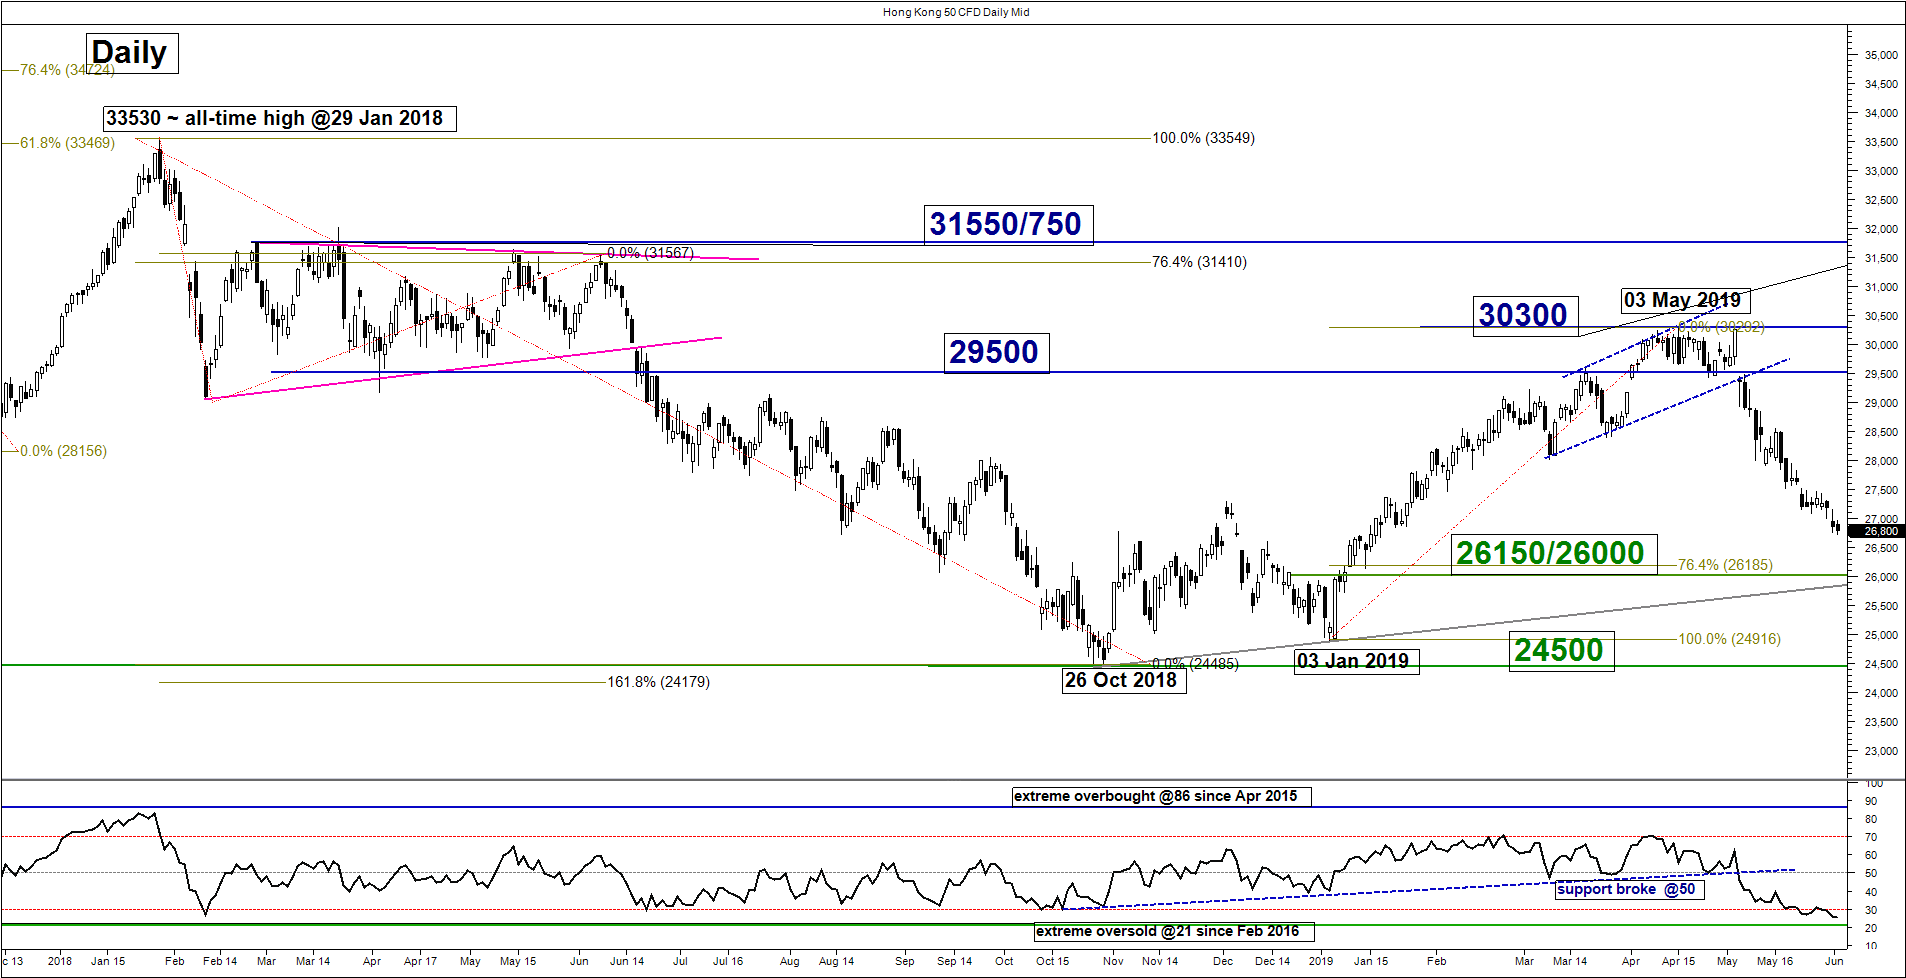
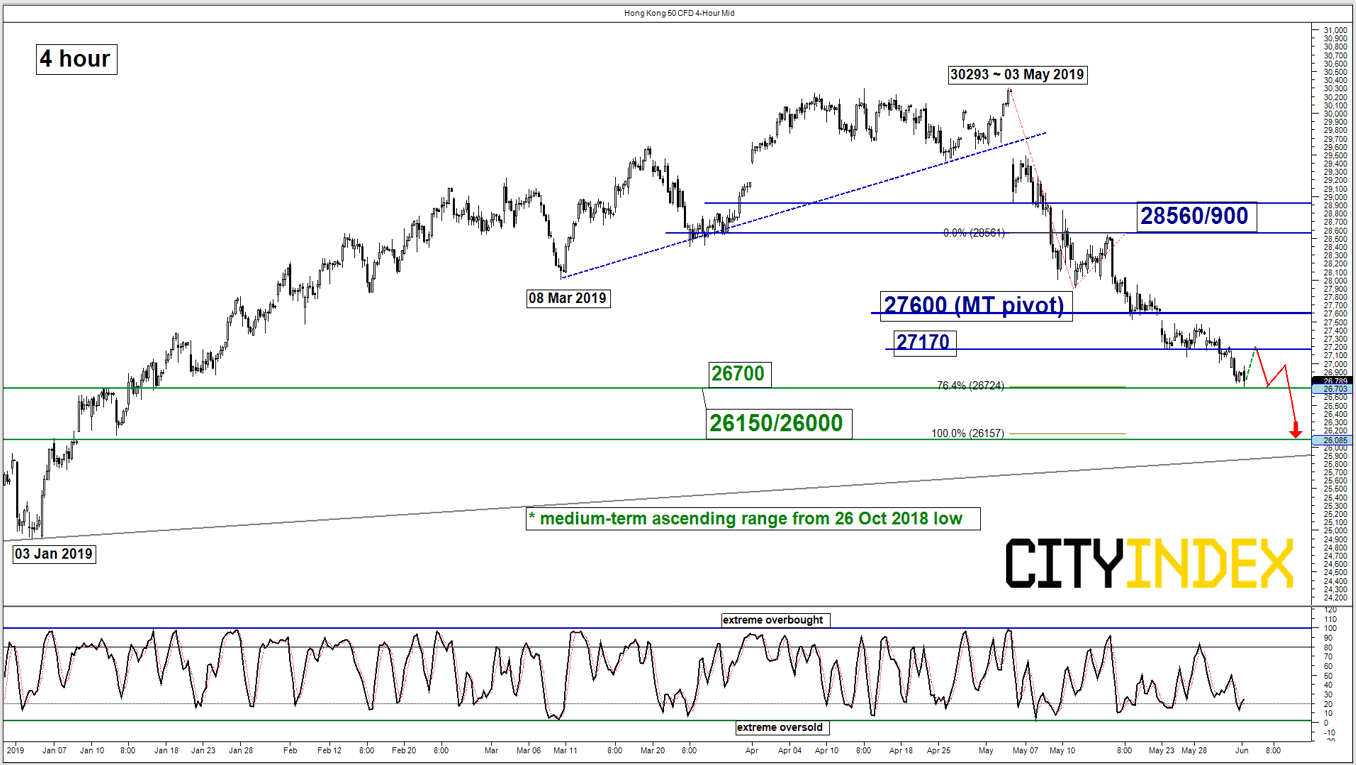
Hang Seng – Further downside below 27600 key resistance
click to enlarge charts
Key Levels (1 to 3 weeks)
Intermediate resistance: 27170
Pivot (key resistance): 27600
Supports: 26700 & 26150/26000
Next resistances: 28560/900
Medium-term (1 to 3 weeks) Outlook
Last week, the Hong Kong 50 Index (proxy for Hang Seng Index futures) had managed to stage the expected decline to hit the first medium-term target/support of 26700 as per highlighted in our previous report. In today, 03 Jun Asian session, it has printed a current intraday low of 26724.
No major changes on its key technical elements, except for the risk of an imminent minor correct rebound towards 27170 as indicated by an oversold reading seen in the 4-hour Stochastic oscillator. Maintain bearish bias with a tightened key medium-term pivotal resistance now at 27600 for another potential downleg to target a key medium-term support at 26150/26000 (ascending range in place since 26 Oct 2018 low & Fibonacci retracement/expansion cluster).
On the other hand, a clearance with a daily close above 27600 invalidates the bearish scenario for a squeeze up towards the next resistance at 28560/900 (also the 50%/61.8% Fibonacci retracement of the on-going decline from 03 May high to 03 Jun 2019 current intraday low of 26724).
ASX 200 – Further potential drop towards “Expanding Wedge” support
click to enlarge charts
Key Levels (1 to 3 weeks)
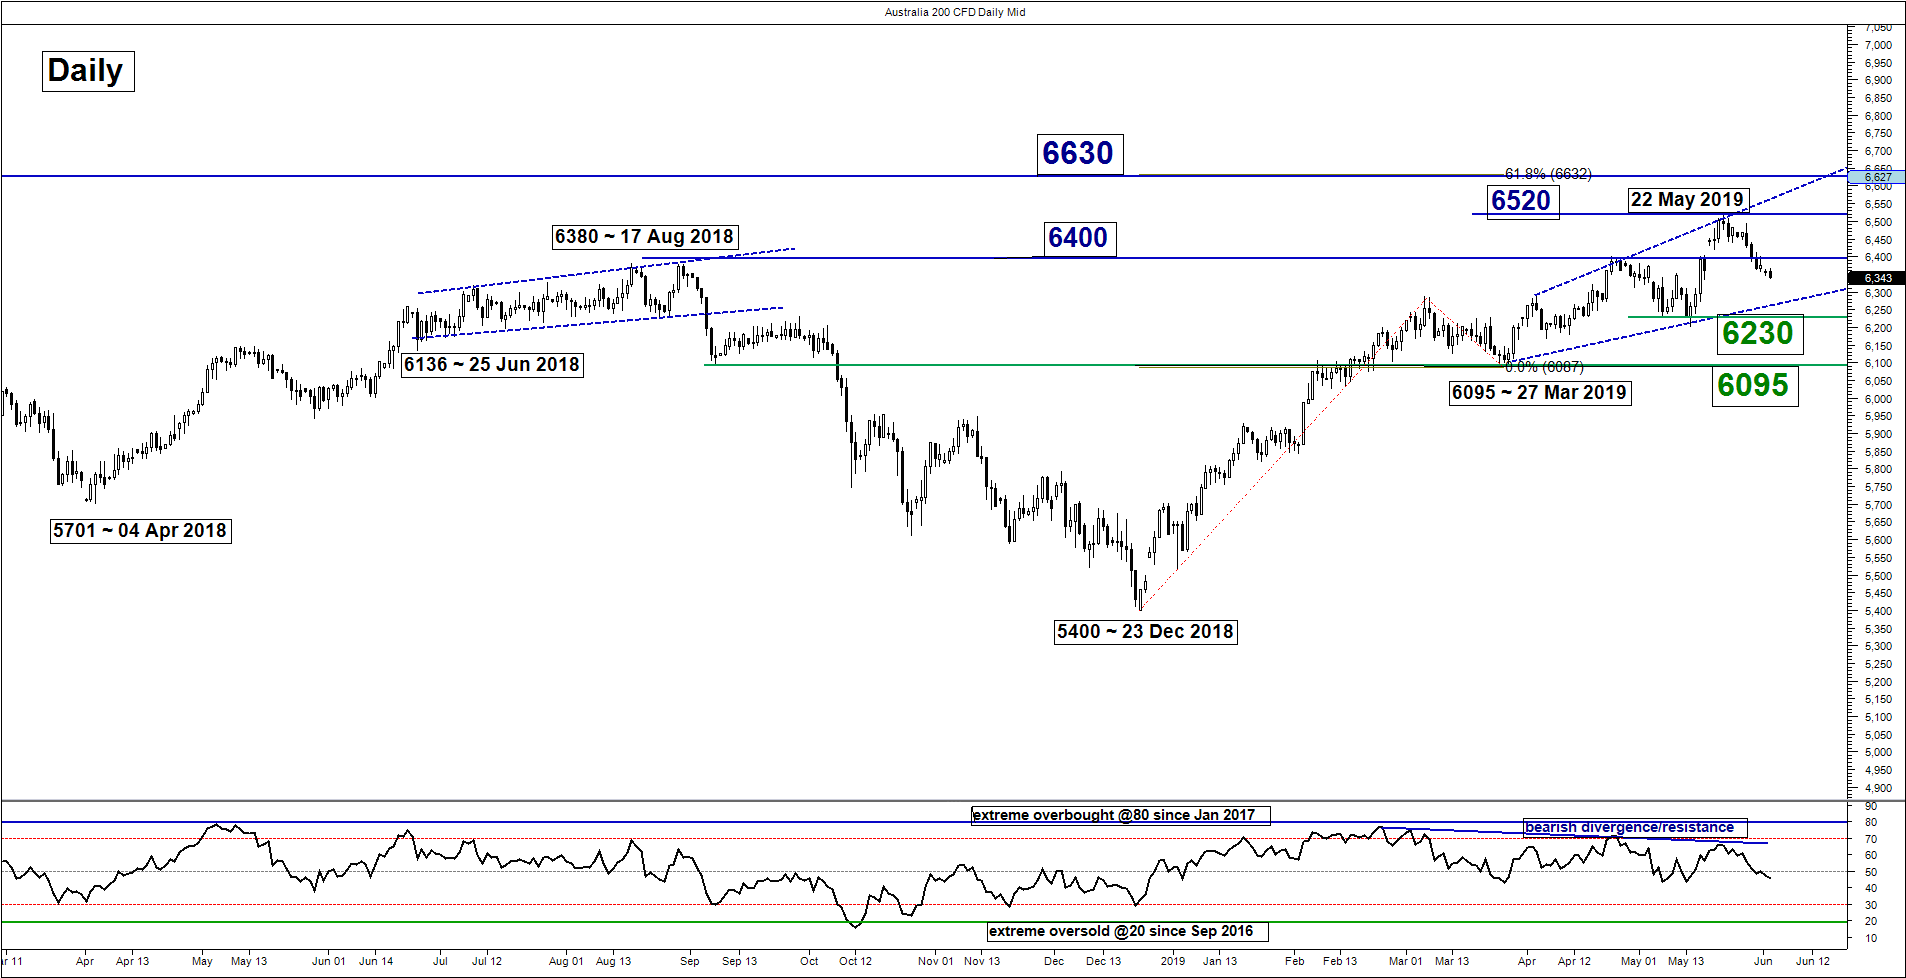
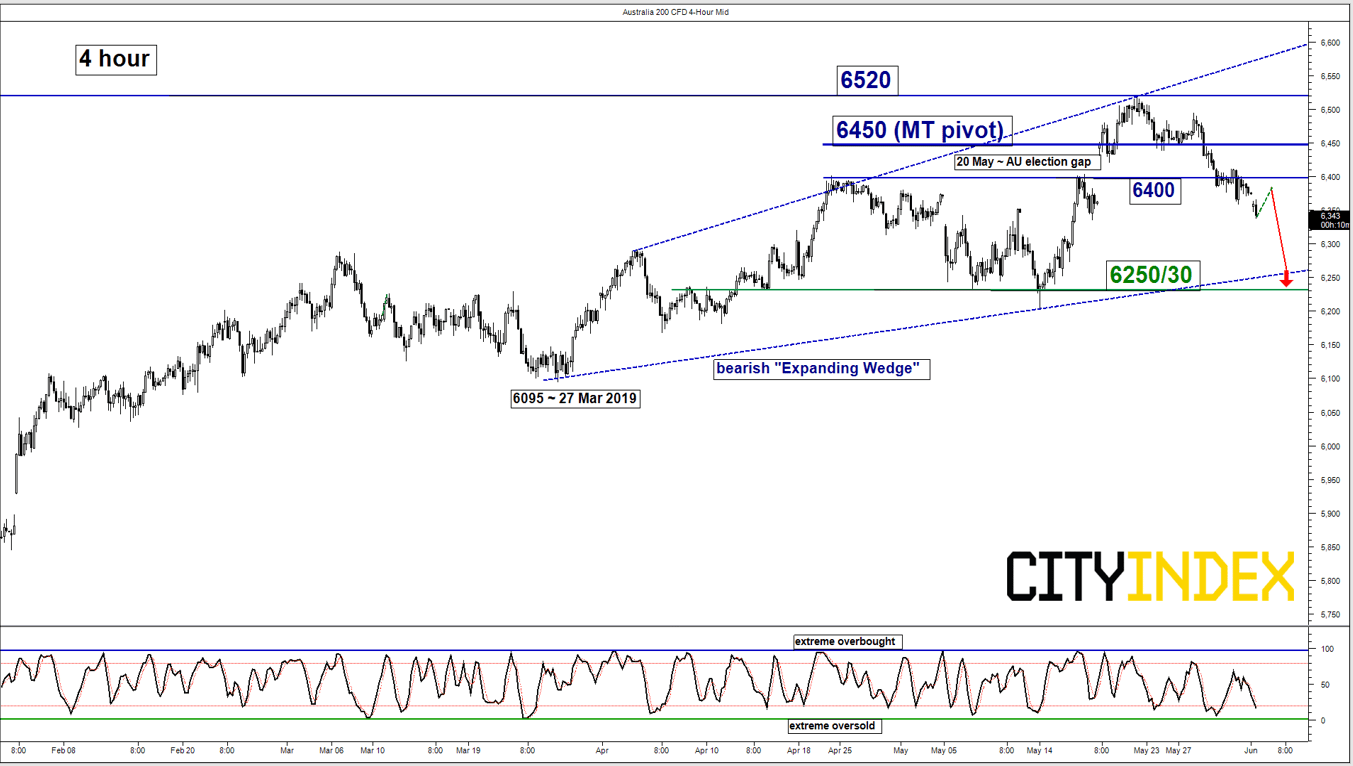
Intermediate resistance: 6400
Pivot (key resistance): 6450
Support: 6250/30
Next resistances: 6520 & 6630
Medium-term (1 to 3 weeks) Outlook
Last week, the Australia 200 Index (proxy for the ASX 200 futures) had staged the breakdown below the lower limit of the neutrality zone at 6400 (also the gapped up formed on 20 May, post AU election) where we expressed our cautious stance in our previous report despite recent weeks of rising price action.
Bearish bias now in any bounces below 6450 key medium-term pivotal resistance (also the 61.8% Fibonacci retracement of the on-going slide from 22 May high to today Asian session, 03 Jun current intraday low of 6338) for a further potential push down to test the bearish “Expanding Wedge” range support at 6250/30.
On the other hand, a clearance with a daily close above 6450 invalidates the bearish scenario for a continuation of the impulsive up move to retest 22 May 2019 swing high area of 6520 before targeting 6630 next.
DAX – Corrective rebound before potential fresh down move
click to enlarge charts
Key Levels (1 to 3 weeks)
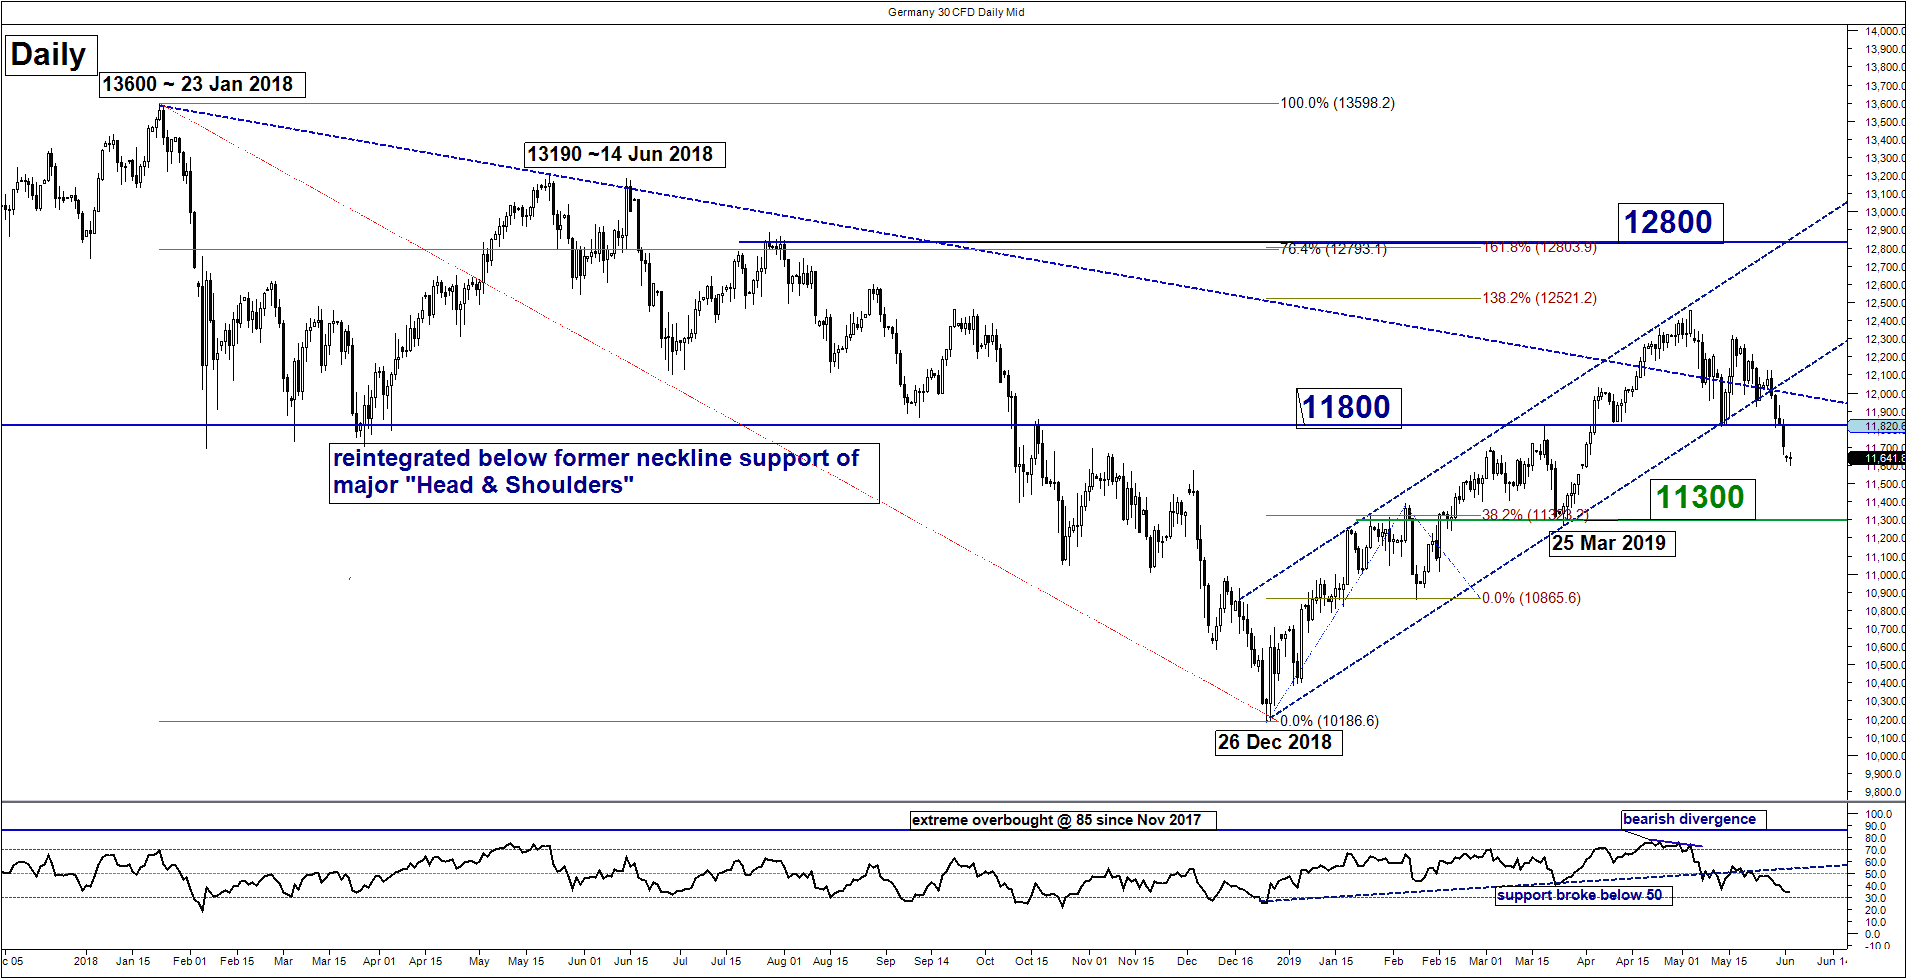
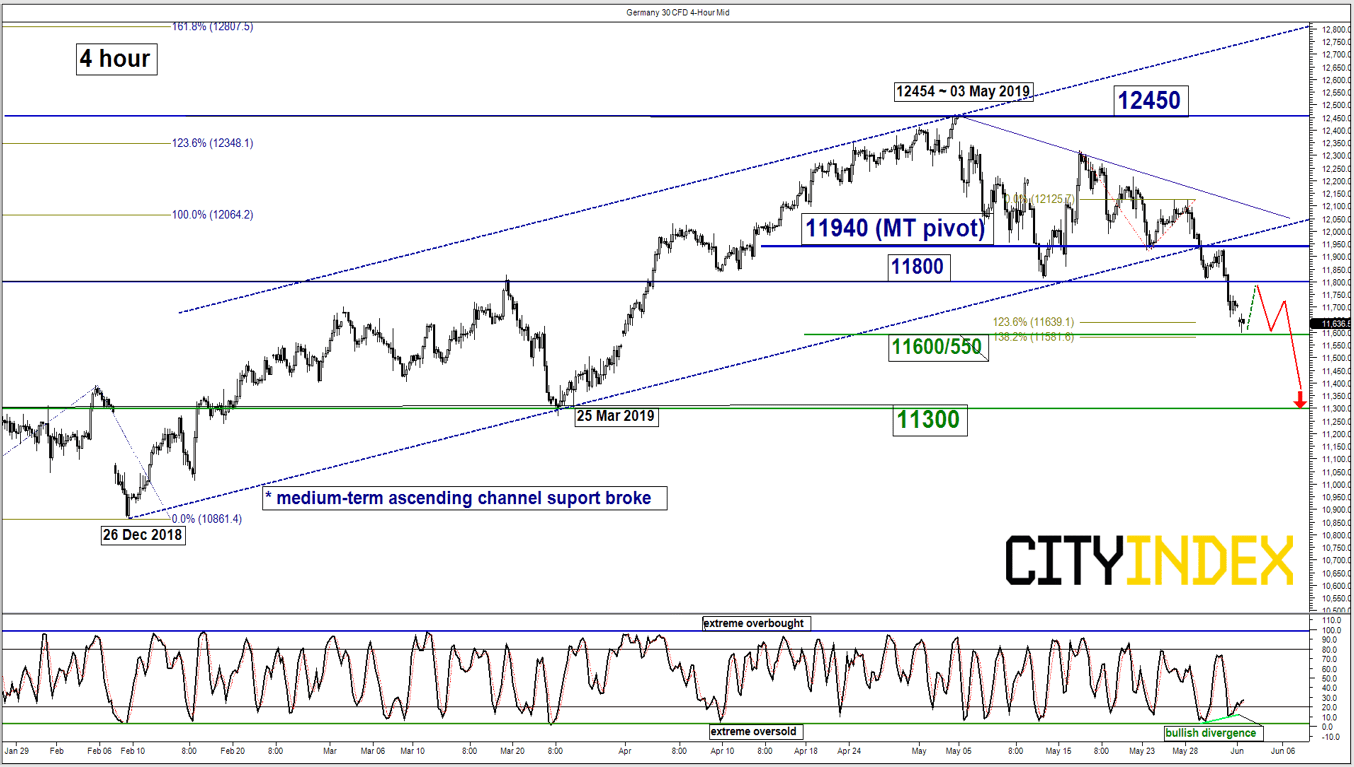
Intermediate resistance: 11800
Pivot (key resistance): 11940
Supports: 11600/550 & 11300
Next resistance: 12450
Medium-term (1 to 3 weeks) Outlook
Last week, the Germany 30 Index (proxy for the DAX futures) had staged the bearish breakdown below the key 11800 level (medium-term ascending channel support in place since 26 Dec 2018 low & former major “Head & Shoulders” neckline support).
Medium-term technical elements have been reinforced to advocate for further weakness ahead within 1 to 3 weeks horizon. However, there is a risk of an imminent minor corrective above the 11600/550 intermediate support as the 4-hour Stochastic oscillator has shaped a bullish divergence signal at its oversold region which indicates a slowdown in downside momentum of current price action.
Thus, we flip to a bearish bias in the medium-term with 11940 as the key medium-term pivotal resistance to cap the minor corrective rebound before another potential impulsive down move materialises to target the next support at 11300 (also the 50% Fibonacci retracement of the entire up move from 26 De 2018 low to 03 May 2019 high).
On the other hand, a clearance with a daily close above 11940 invalidates the bearish scenario for a squeeze up to retest the 03 May 2019 swing high of 12450.
Charts are from City Index Advantage TraderPro & eSignal
Latest market news
Yesterday 01:32 PM
Yesterday 09:35 AM
Yesterday 07:23 AM
Yesterday 04:48 AM
Yesterday 12:17 AM
July 25, 2024 10:39 PM
Latest Indices articles

July 25, 2024 01:30 PM

July 25, 2024 01:01 AM

July 25, 2024 12:41 AM

July 24, 2024 07:26 PM