


June 15, 2022 4:09 PM

Last week’s CPI for May was 8.6% YoY, the highest level since December 1981. Has the high level of inflation reached the point that American consumers are willing to spend less due to higher prices? The headline Retail Sales print for May was -0.3% MoM vs +0.2% MoM expected. Therefore, it appears inflation may be causing consumers a bit of concern. In addition , the April number was revised from +0.9% MoM down to +0.7% MoM, which makes May’s number even worse. The main culprit for the lower print was a decrease in new car and trucks. Excluding autos, the print was +0.5% MoM. However, the expectation was for +0.8% MoM. As with the headline print, the ex-autos number for April was revised down, from +0.6% MoM to +0.4% MoM. For good measure, the ex-gas/autos print was +0.1% MoM in May vs +0.8% MoM in April.
USD/CAD had been trading in a range since mid-November 2021 between 1.2454 and 1.2965. On May 9th, the pair broke briefly through the top of the range and made a high of 1.3077. By May 13th, USD/CAD had pulled back within the range and formed a Head and Shoulders pattern. The target for a head and shoulders pattern is the height from the head to the neckline, added to the and breakdown point below the neckline. In this case, the target was near the bottom of the range, at 1.2450. Price came up a bit short of the target, reaching just below the 78.6% Fibonacci retracement from the spike low on April 5th to the highs on May 12th, near 1.2518. Since then, USD/CAD rose in dramatic fashion over the last 5 trading sessions to the top of the range, near 1.2975.
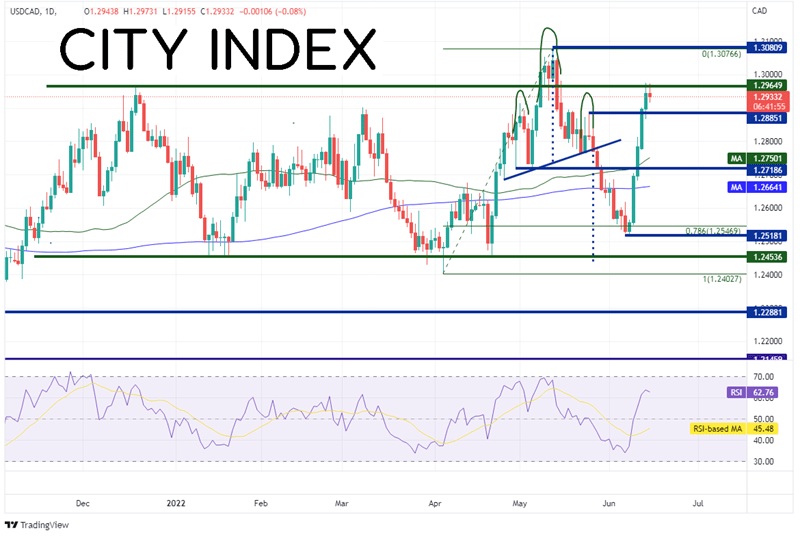
Source: Tradingview, Stone X
Trade USD/CAD now: Login or Open a new account!
• Open an account in the UK
• Open an account in Australia
• Open an account in Singapore
On a 240-minute timeframe, interestingly, USD/CAD moved higher to the 78.6% Fibonacci retracement level from the highs of May 12th to the lows of June 7th, near 1.2960. If price is to continue higher, the next level of horizontal resistance is at 1.2995 (slightly above the top of the long-term range on the daily). Above there, price can move to the May 12th highs at 1.3077, However, notice that the RSI is in overbought territory and turning lower, and indication that USD/CAD may be ready for a pullback. First support is a zone of support between 1.2866 and 1.2900. Below there, price can fall to the 50 Day Moving Average at 1.2750 (see daily), then horizontal support near 1.2686.
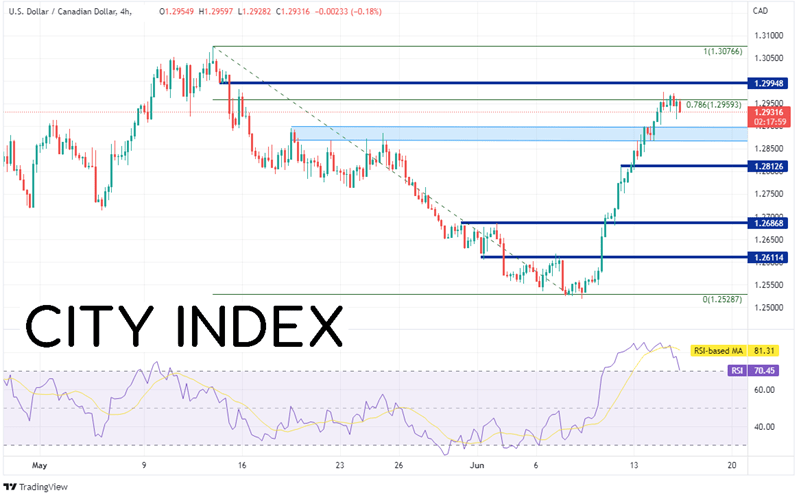
Source: Tradingview, Stone X
Is inflation affecting retail sales? It sure seems like it. Is a recession ahead? Possibly, but we’ll have to wait for more data to determine that. USD/CAD had been on a tear lately and has stalled its ascent near the 78.6% Fibonacci retracement level. The RSI is also pointing lower, in overbought territory, on the shorter timeframe. Watch for a pullback in the near-term.
Learn more about forex trading opportunities.
Latest market news
Yesterday 01:32 PM
Yesterday 09:35 AM
Yesterday 07:23 AM
Yesterday 04:48 AM
Yesterday 12:17 AM
July 25, 2024 10:39 PM
Latest Trade Ideas articles

Yesterday 09:35 AM

Yesterday 12:17 AM

July 25, 2024 10:39 PM

July 25, 2024 05:30 PM