


November 2, 2022 4:17 PM

The average MBA 30-Year Mortgage Rate for the week ending October 28th fell to 7.06%. This was the first weekly decrease in the benchmark rate in 11 weeks. The previous week’s reading of 7.16% was the highest since 2001. With interest rates this high, the US housing data for September fell in most of the key data points as home buyers moved to the sidelines. Pending Home sales were down 10.2% MoM vs a previous reading of -1.9% MoM. New Home Sales were down 10.9% MoM vs an August reading of +24.7% MoM. Finally, Existing Home Sales were down 1.5% MoM vs -0.8% MoM in August. On the bright side for buyers, the S&P/Case-Schiller Home Prince Index fell 1.6% MoM, although this hardly makes up for the jump in interest rates. The big question housing buys want to know is “Will interest rates fall further below the 2001 levels anytime soon?”
30 Year Mortgage rates in the US are based primarily off the 10-year US Treasury Yield. After breaking above a symmetrical triangle (red) early in 2022 near 1.69%, yields began moving aggressively higher. Yields moved to 3.497% on June 14th and pulled back to 2.56% in August 2nd. This set up an ascending wedge formation. Expectations are that the yield will break lower out of an ascending wedge. However, as price neared the apex, it initially broke above the formation on October 20th, reaching a high of 4.335% on October 21st. Notice that the RSI was diverging with yields in overbought territory. Thus, yields have since pulled back to the bottom trendline of the wedge, making a near-term low of 3.90%.
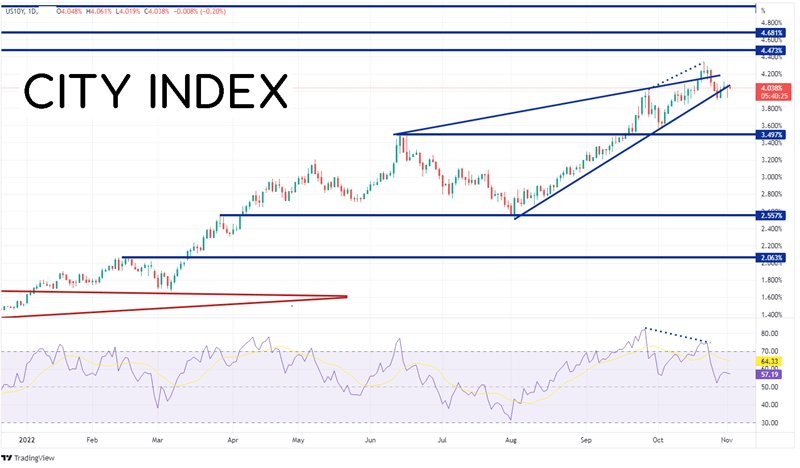
Source: Tradingivew, Stone X
Trade 10 year Treasury bonds now: Login or Open a new account!
• Open an account in the UK
• Open an account in Australia
• Open an account in Singapore
Heading into the November FOMC meeting, the US 10-year Yield has pulled back and is oscillating around 4%. If the key yield breaks higher after the FOMC meeting, first resistance is at the lows of October 24th near 4.13%, then the top trendline of the long-term wedge near 4.23%. If yields continue higher and breakthrough the October 24th highs of 4.335%, they could be on the way to 4.473%, the highest level since November 2007! However, if the resistance holds and 10-year yields move lower, the first support is at the 38.2% Fibonacci retracement level from the lows of August 2nd to the highs of October 21st at 3.64%. Below there, yields can fall to the highs of June 14th at 3.497% and then the 50% retracement of the previously mentioned timeframe at 3.426%.
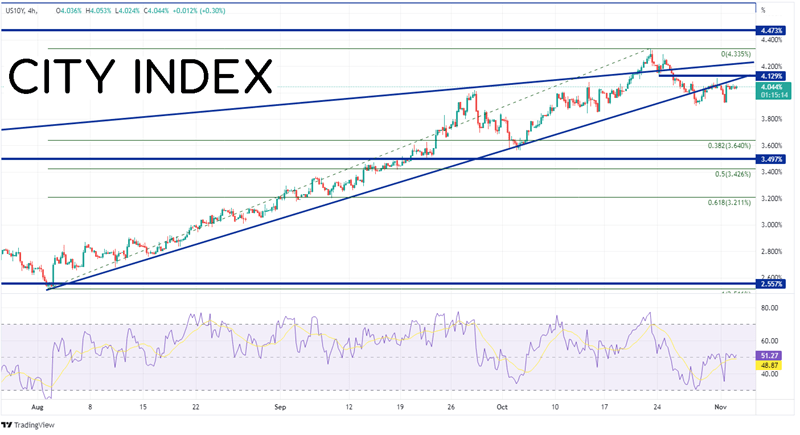
Source: Tradingivew, Stone X
When will the housing market turn up again? This will most likely be after mortgage rates move lower, which will depend on the movement of the US 10-year treasury yield. Watch the Fed later today. A 75bps rate hike is already priced. However, traders need to pay attention to the statement and the press conference which follows to determine if the Fed will slow the pace of hikes moving forward!
Learn more about forex trading opportunities.
Latest market news
Yesterday 01:32 PM
Yesterday 09:35 AM
Yesterday 07:23 AM
Yesterday 04:48 AM
Yesterday 12:17 AM
July 25, 2024 10:39 PM
Latest Trade Ideas articles

Yesterday 09:35 AM

Yesterday 12:17 AM

July 25, 2024 10:39 PM

July 25, 2024 05:30 PM