


Gold lacks direction ahead of the Fed meeting
Gold is holding steady, lacking direction around 1925 ahead of the Federal Reserve rate decision.
Gold had risen over 5% across January on optimism that the Fed could slow the pace of rate hikes. And while the Fed is expected to slow the pace of hikes, this does not mean that a dovish pivot is coming.
The Fed is widely expected to slow the pace of rate hikes to 25 basis points taking the benchmark rate to a range of 4.5%-4.75%. The move would mark the smallest rate hike by the Fed since they started hiking in March last year. However, with inflation still over 3 times the Fed’s target level, Fed Chair Jerome Powell could underscore the Fed’s commitment to staying the course and reiterate that rates could remain high for some time.
A more hawkish than expected-sounding Fed could boost the USD and pull non-yielding gold lower.
Prior to the Fed meeting, there is plenty of US data that could create some volatility, including ADP employment change, ISM manufacturing, and JOLTS job openings.
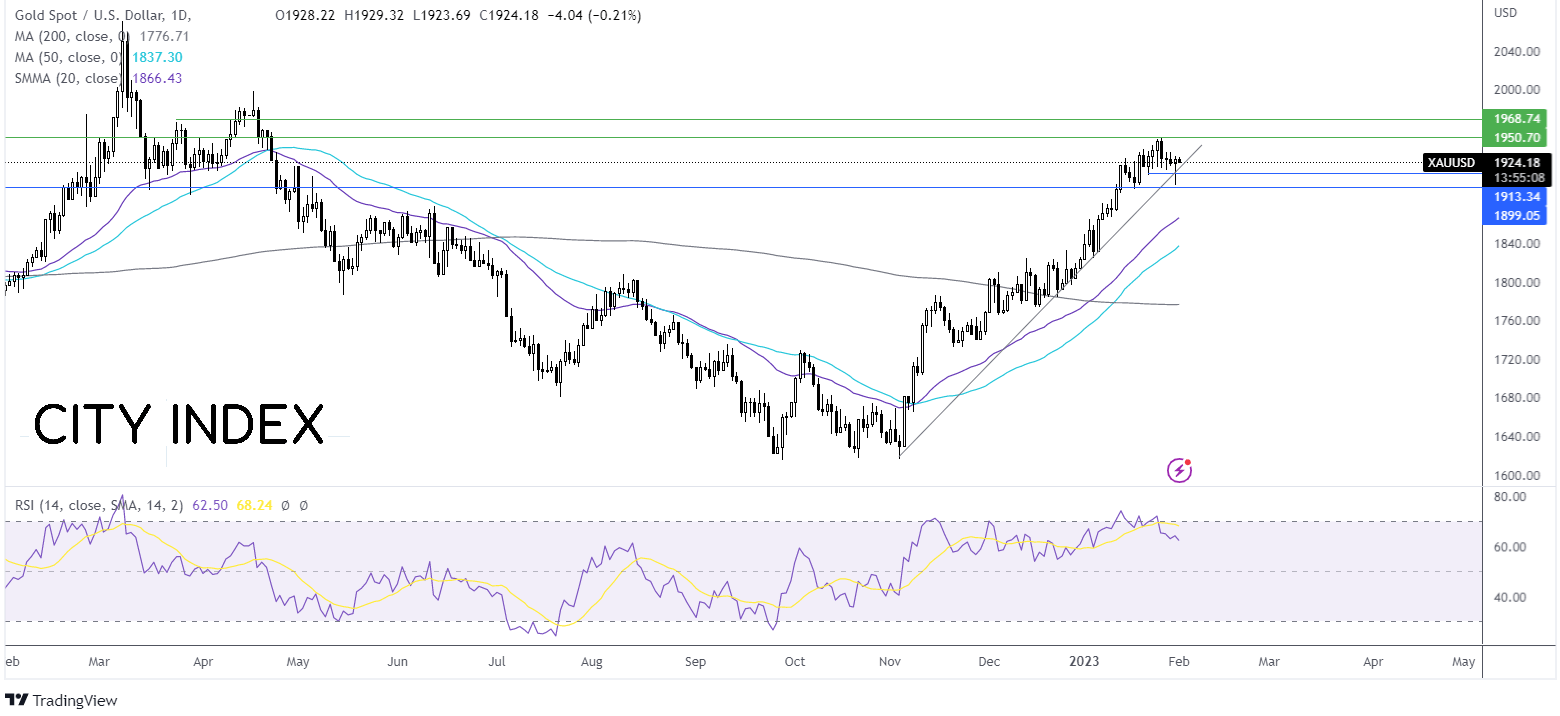
Where next for Gold prices?
Gold continues to trade in a familiar range after testing 1900 in the previous session. The holding of support at 1900, combined with the bullish RSI, which is comfortably over 50 is keeping buyers hopeful of further gains.
Buyers could look for a rise over 1935, the weekly high to bring 1949 back into focus. A rise over here creates a higher high and open the door to 1968 the March 24 high.
Sellers need to break below 1900 to negate the buy-the-dip scenario and create a lower low. A break below here exposes the 20 sma at 1865.
Oil looks to Fed & OPEC+ meeting
Oil rebounded off a 3-week low yesterday as signs of slowing US inflation helped ease the recession in the world’s largest consumer of oil. An upward revision to global growth from the IMF added to the upbeat mood, which along with China reopening, underpins oil prices.
Meanwhile, larger-than-expected crude stock inventory is keeping the lid on gains. US stockpiles rose 6.3 million barrels in the week ending January 27. This was ahead of the 400k barrels build forecast. EIA inventory data is due later.
Today, investors are adopting a more cautious stance ahead of the Fed rate decision, which could shed more light on the prospects of a soft landing in the US, and ahead of the OPEC+ meeting, where the group of oil producers is expected to keep oil output unchanged.
OPEC’s oil output fell in January as exports from Iraq fell, and Nigeria’s output failed to recover. Together OPEC produced 92k bpd below the target level; this was a larger deficit than that of 780k in December.
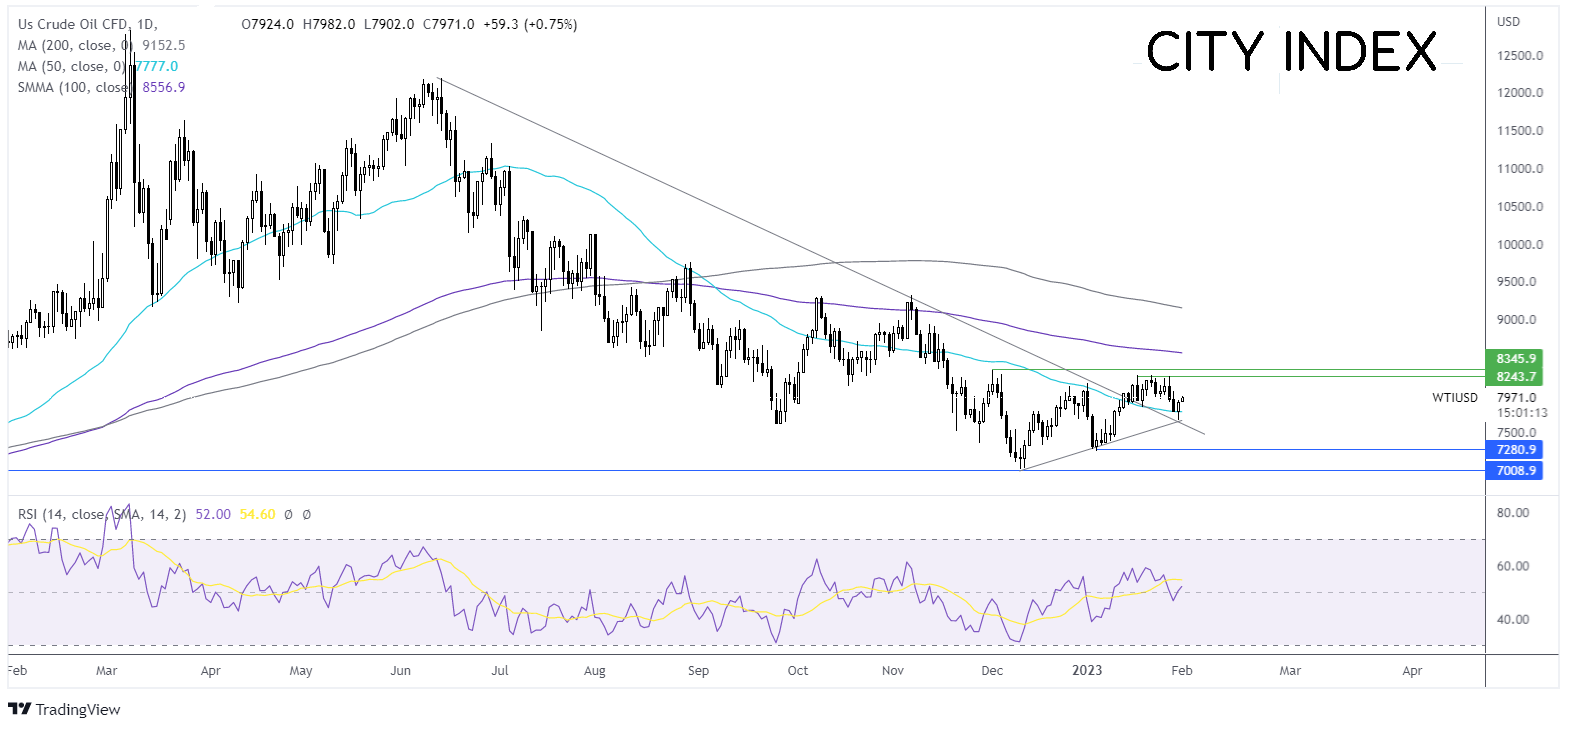
Where next for oil prices?
After finding support at 76.60, the three-week low and the intersection of the multi-week rising trendline and multi-month falling trendline, oil prices rebounded, closing above the 50 sma, although the upside remains capped by 82.50 last week’s high. The RSI is neutral, around 50.
A breakout trade could be on the cards. Buyers could look for a rise over 82.50 to extend gains towards 83.30 the December high. A break above here exposes the 100 sma at 85.50.
Meanwhile, sellers could look for a break below the 50 sma at 78.00 to open the door to 76.60, which could be a tough nut to crack. A break below this level opens the door to 72.70, the 2023 low.
Latest market news
Yesterday 01:32 PM
Yesterday 09:35 AM
Yesterday 07:23 AM
Yesterday 04:48 AM
Yesterday 12:17 AM
July 25, 2024 10:39 PM
Latest Trade Ideas articles

Yesterday 09:35 AM

Yesterday 12:17 AM

July 25, 2024 10:39 PM

July 25, 2024 05:30 PM