


FTSE looks to re-test its all-time high
The FTSE, along with its European peers, is set to open the day higher, following on from an upbeat close on Wall Street, after Federal Reserve Chair Powell sounded less hawkish than the markets had feared given Friday’s strong nonfarm payroll report.
Powell reiterated that disinflation was in process and that 2023 would be a year of significant declines in inflation. He added that If data continued to come in stronger than expected, then interest rates would certainly need to rise.
His comments helped to boost sentiment, lifting stocks and pulling the USD lower. This upbeat sentiment is translating to a stronger open in Europe.
The FTSE has managed to climb to record highs, thanks in part to its heavily weighted resource stocks as commodities prices have been boosted by China reopening. A 2.8% fall in the pound last week, also helped to support the many multinationals in the UK index, offering a favorable exchange rate for foreign earnings.
On the corporate calendar, Barratt Developments and Severn Trent are due to report.
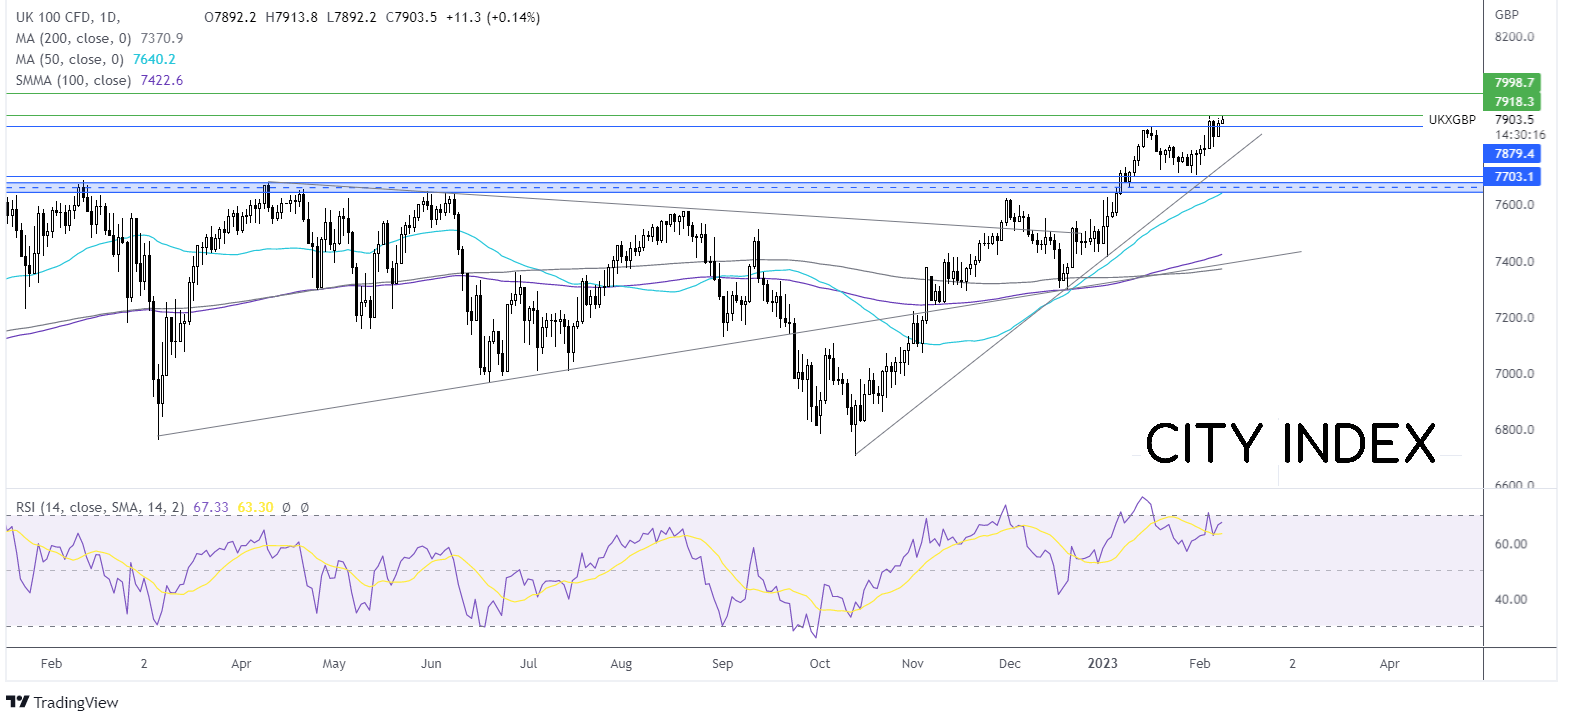
Where next for the FTSE?
The FTSE is attempting to push beyond the 7913 the all-time high reached at the start of the week. The RSI supports further upside while it remains out of overbought territory.
Buyers could look for a rise above 7913 to bring 8000 the round number into focus.
On the flip side, immediate support can be seen at 7880, the January high. A break below here could bring 7770 the rising trendline support dating back to October into focus. A fall below 7706, the 2023 low is needed to create a lower low.
Oil holds strong gains ahead of EIA inventory data
Crude oil prices jumped 4% in the previous session and are holding onto those gains today. risk assets were boosted by a less hawkish than feared Federal Reserve chair Jerome Powell. Powell’s comments, or at least the FX and currency market’s perception of those comments, helped pull the USD lower, also supporting USD-denominated oil.
API inventory data was broadly shrugged off by the market. The API stockpile report showed that inventories unexpectedly rose by 2.1 million barrels in the week ending February 3. The API data also showed that gasoline and distillate stockpiles grew in the past week, suggesting that retail fuel consumption, which is a key driver of US demand, remains under pressure.
EIA data which is due later today is forecast to show an inventory build of 2.45 million barrels.
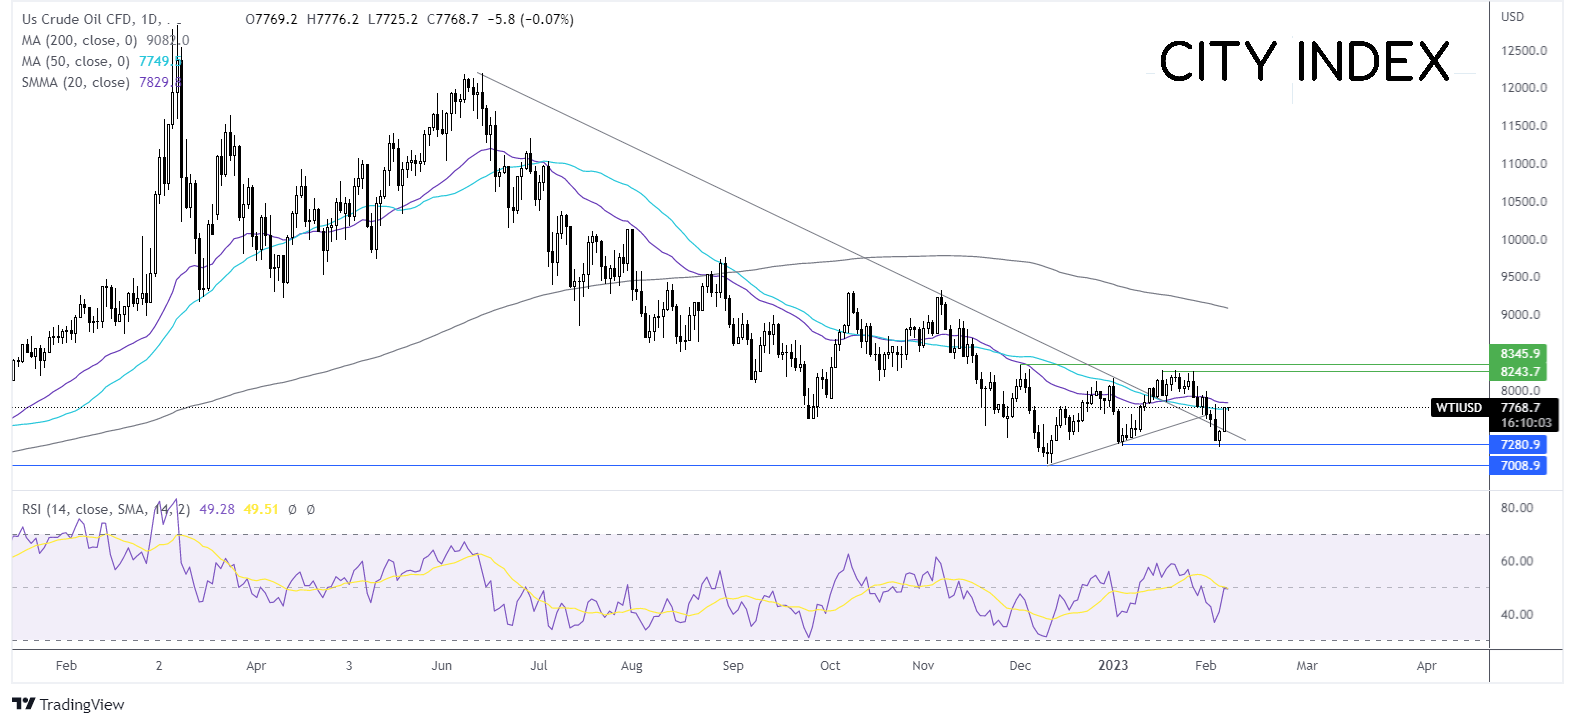
Where next for oil prices?
Having rebounded from 72.40 on Monday, oil prices have risen back above the multi-month falling trendline and have run into resistance at the 50 sma around 77.50. The RSI is neutral.
Buyers need to rise above 77.50 and 78.30 the 10 sma to bring 80.00 the psychological level back into play. A rise above here opens the door to resistance at 82.40-82.70. A rise above here creates a higher high.
On the flip side, should sellers successfully defend the 50 sma, the price could fall back towards 74.60 the falling trendline support and 72.40, for a lower low.
Latest market news
Yesterday 01:32 PM
Yesterday 09:35 AM
Yesterday 07:23 AM
Yesterday 04:48 AM
Yesterday 12:17 AM
July 25, 2024 10:39 PM
Latest Trade Ideas articles

Yesterday 09:35 AM

Yesterday 12:17 AM

July 25, 2024 10:39 PM

July 25, 2024 05:30 PM