


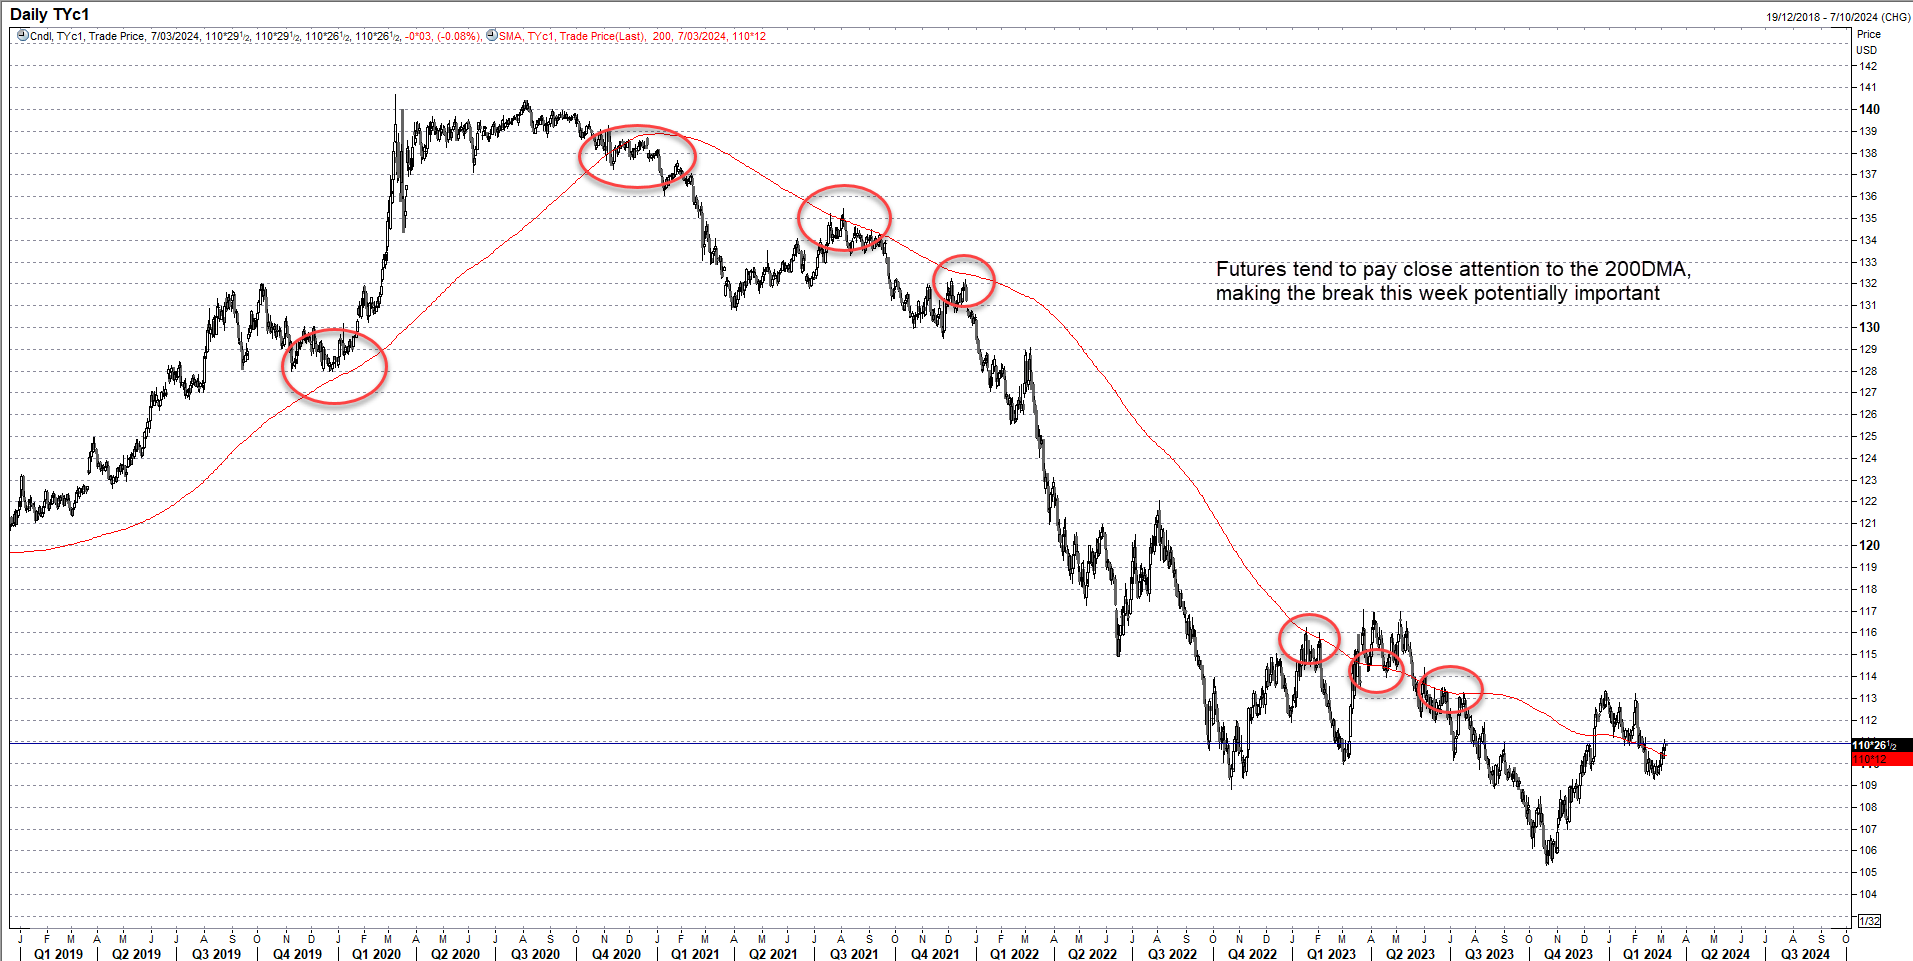
- US 10-year Treasury note futures are arguably the most important financial indicator in the world at any one time
- The break of the 200-day moving average earlier this week may have been implications for markets exposed to currency and interest rate risks
This might be the most important chart in the financial world right now, especially for those who like to dabble in markets exposed to currency or duration risk.
Source: Refinitiv
It’s the daily chart of US 10-year Treasury note futures, or simply TYs for short. Being the contract over the world’s benchmark borrowing rate, it’s an indicator that should be on your radar. As futures typically drive movements in underlying bonds, it provides an early indication on directional risks for yields and the performance of other asset classes.
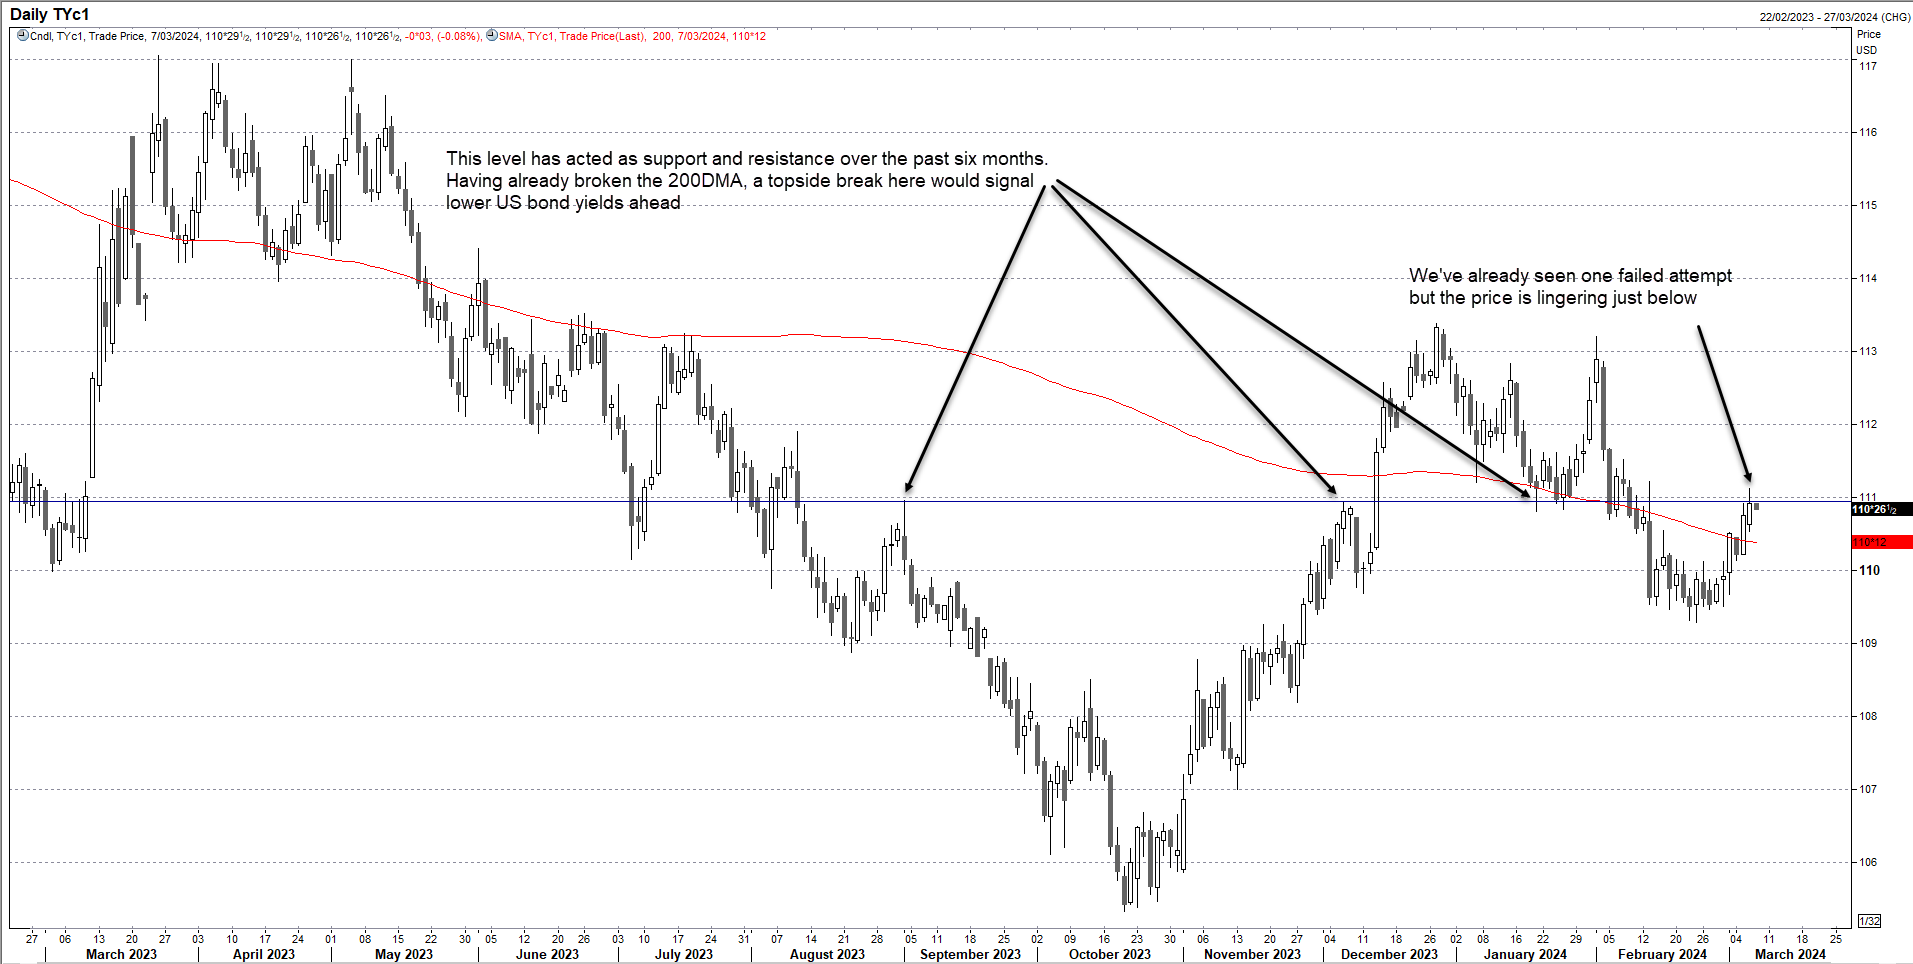
As things stand, TYs are sitting at what looks to be an important pivot point for yields.
Source: Refinitiv
Not only have futures been rallying, sending underlying bond yields lower, but the price has broken through the 200-day moving average, a level it tends to respect based on historical information.
With bonds bid, the last chance saloon for bears looks to be horizontal resistance located just under 111 on the charts, a level that has acted as both support and resistance over the past six months.
Futures attempted to crack resistance on Wednesday only to reverse, spending much of the subsequent Asian session since pondering whether to have another go.
Should the next attempt be successful, sending US bond yields even lower, it will have implications for assets priced in US dollars or whose value is influenced by changes in longer-term interest rate.
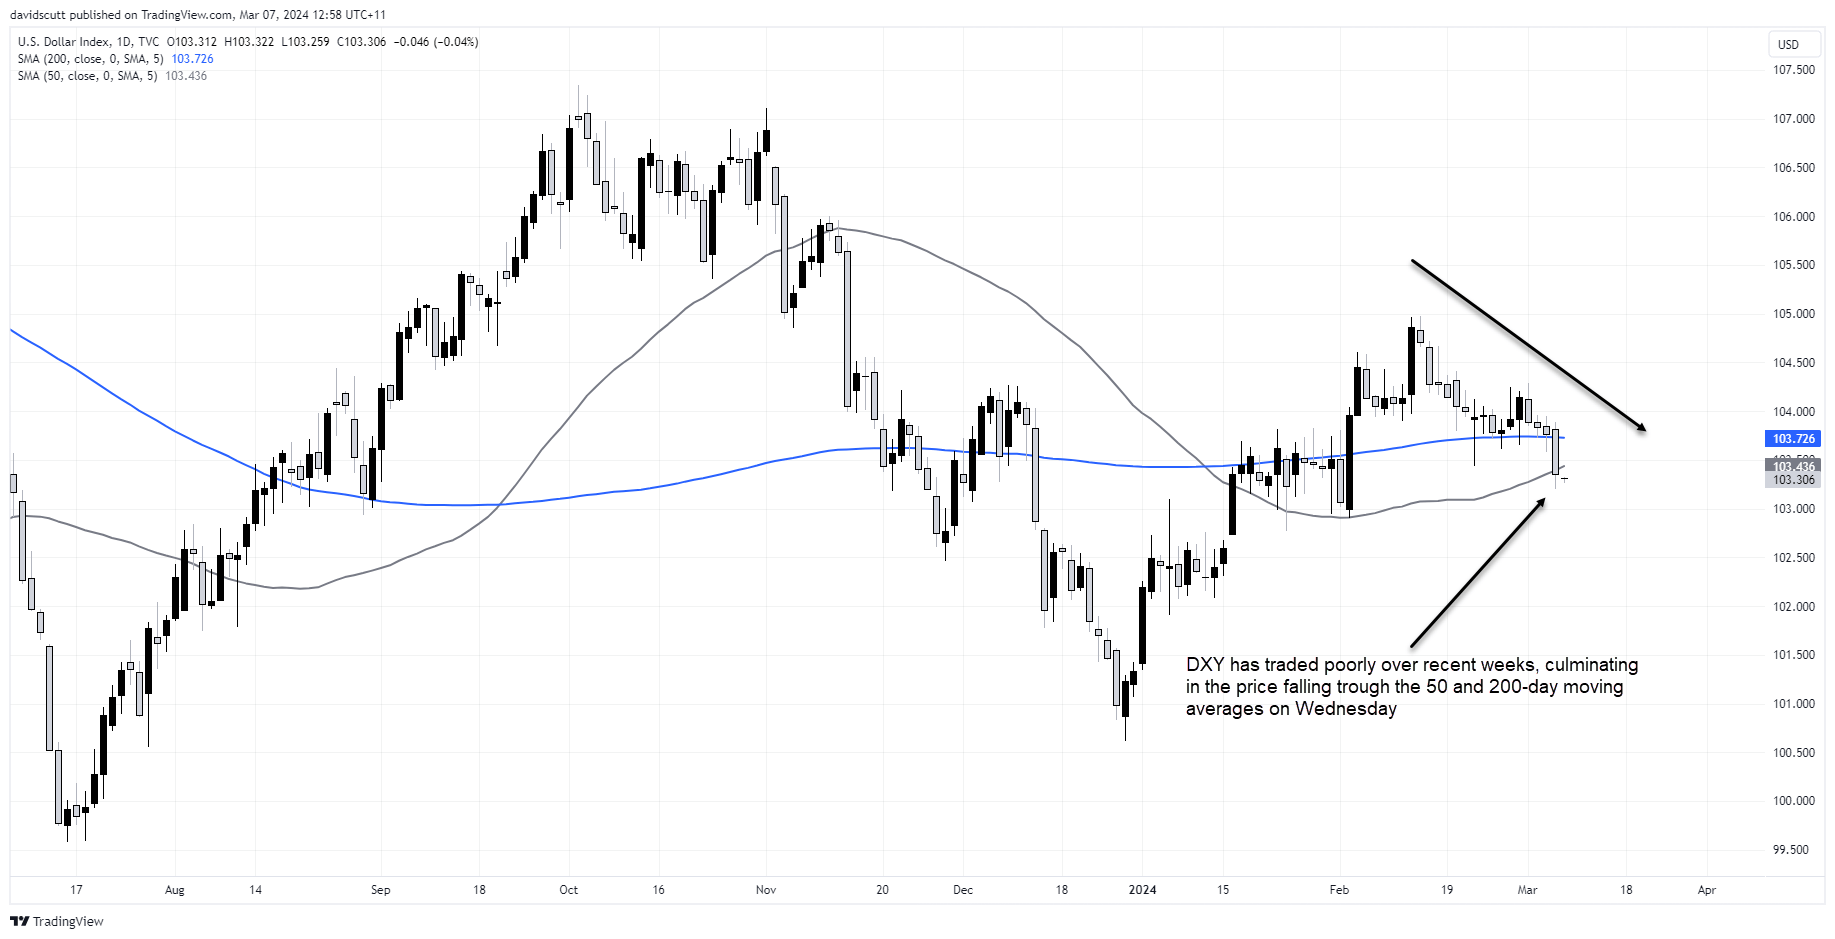
As seen in the US dollar index daily below, DXY broke its 50 and 200-day moving averages this week. It’s rally since the beginning of the year was underpinned by higher US yields, seeing spreads with debt issued by other nations widen. But with US yields now declining, the big dollar is struggling.
I’ve already written about the implications for USD/JPY and Nikkei 225 which have enjoyed a strong correlation with US yields in 2024, but a successful topside break in TY futures could see the influence spread quickly to other markets and asset classes where long bond yields can be influential.
Think precious metals, small cap stocks, tech stocks ex-magnificent 7, commodities priced in dollars, crypto. There are others, explaining why the TY chart is so important right now.
-- Written by David Scutt
Follow David on Twitter @scutty
How to trade with City Index
You can trade with City Index by following these four easy steps:
-
Open an account, or log in if you’re already a customer
• Open an account in the UK
• Open an account in Australia
• Open an account in Singapore
- Search for the market you want to trade in our award-winning platform
- Choose your position and size, and your stop and limit levels
- Place the trade
Latest market news
Yesterday 01:32 PM
Yesterday 09:35 AM
Yesterday 07:23 AM
Yesterday 04:48 AM
Yesterday 12:17 AM
July 25, 2024 10:39 PM
Latest Bonds articles

July 1, 2024 11:04 PM

May 30, 2024 06:11 AM


May 3, 2024 01:00 AM