


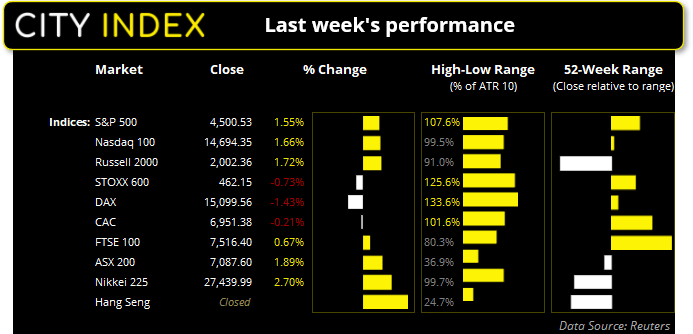
US and European markets diverged last week
Both European and US indices rallied from their lows at the beginning of last week, which set the stage for a decent recovery for sentiment. Yet this momentum was not sustained in Europe following a hawkish ECB press conference. All it took was for ECB’s president Christine Lagarde taking a slightly hawkish stance to send rippled across markets and weigh broadly on their stock markets. The STOXX 600 and DAX began selling off on Wednesday through to the close on Friday.
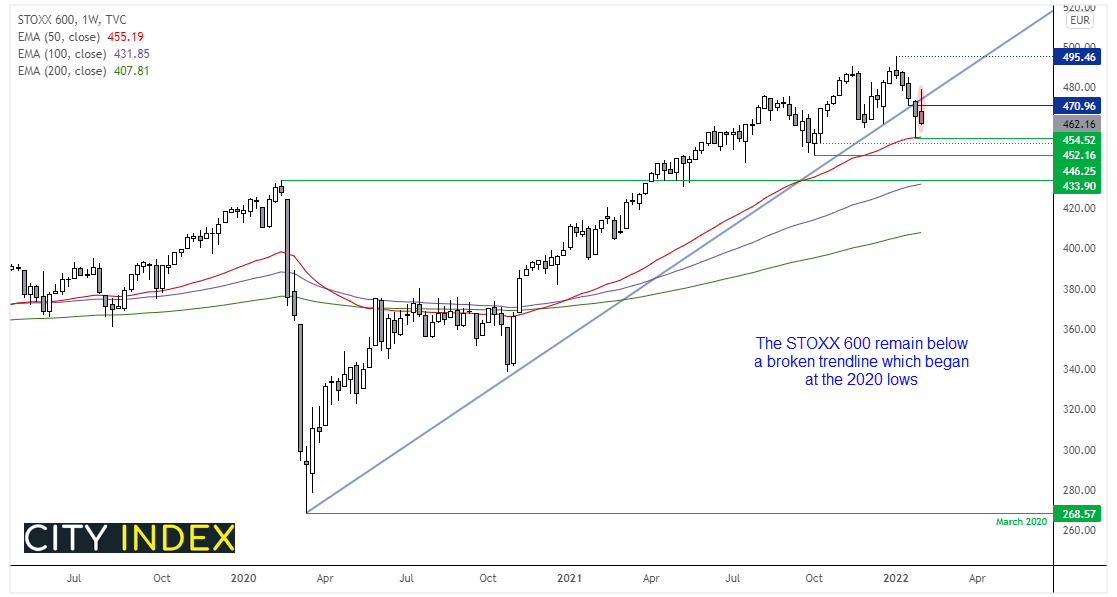
We can see on the STOXX 600 weekly chart that it broke a key trendline two weeks ago. This is significant because the trendline was projected from the March 2020 low, when central banks unleashed unprecedented levels of stimulus. Whilst the initial sell-off below the trendline held above the 50-week eMA, last week’s rally failed to hold above the trendline and effectively confirmed it as resistance. We’re now looking for the 454 low to be retested and eventually broken over the coming week/s.
EuroStoxx Index>
Volatile week for Wall Street around tech earnings
It was also a turbulent week for US indices, but one with a happier ending. A shocking Q1 earnings outlook from Meta Platforms (formerly Facebook) weighed heavily on US stocks and, in particular, the Nasdaq. Trader’s priced in doom and gloom on Thursday until a strong earnings report from Amazon seemed to reverse earlier fears and allow US indices to post a minor gain for the week. But as we note below, this could be a pivotal week for US indices as they need to decide whether they will continue to rally or roll over once more, in line with losses from the January record highs.
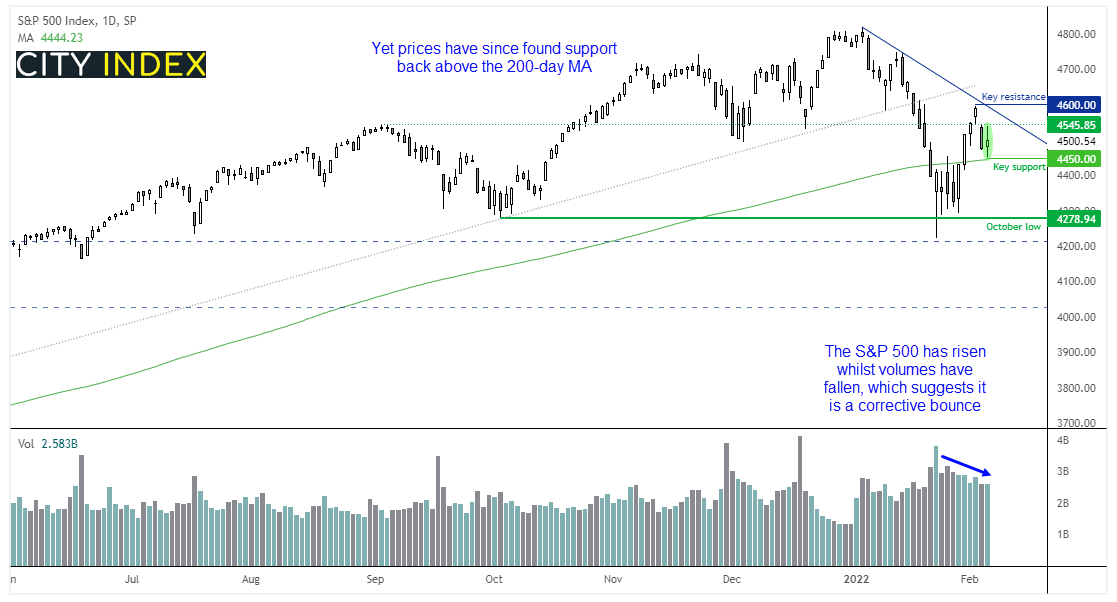
The S&P 500 finds itself at an interesting juncture. Last week’s rally was achieved whilst volumes were declining, and that can be indicative of a corrective move. The decline from the January high was coupled with rising volumes which suggests bears were entering the market, so to see volumes then fall as prices rise then suggests there’s not much initiative buying going on. The rebound also topped out just below trend resistance, so whilst prices remain below 4600 our bias remains bearish and for a break to new lows.
However, Friday printed a small bullish candle and found support at the 200-day average. And as that is a closely watched indicator it does bring the potential for a rally from current levels, at least over the near-term. Therefore, whilst prices remains above Friday’s low then bulls could target the descending trendline. And a break above 4600 strongly suggests that the corrective low from the January high was seen on the 24th January.
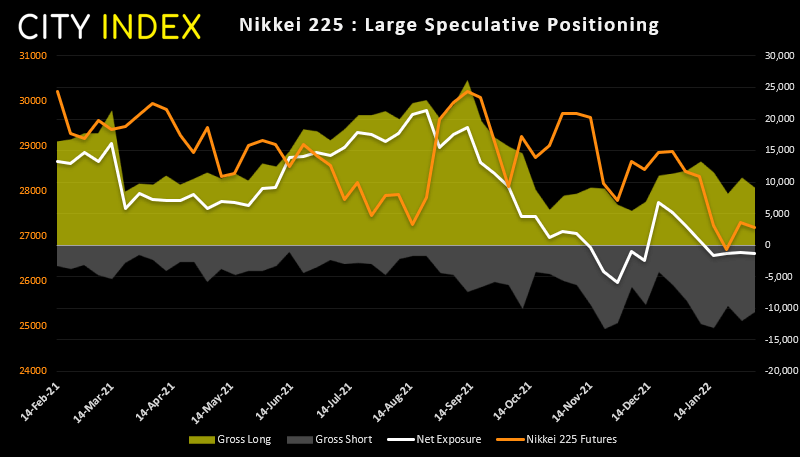
Nikkei futures positioning (priced in yen):
Traders remained net-short Nikkei futures for a fourth consecutive week, according to data from CFTC (Commodities Futures Trading Commission). Seeing net-short exposure on the Nikkei has not been the norm in recent years, as it has been net-short just 13.9% of the time over the past three years. Yet what we also notice is how gross longs quickly declined between September and October last year and have not made a big effort to return. For this reason we continue to suspect the Nikkei could move lower over the coming weeks once its current corrective bounce has completed.
Nikkei 225 index:
A bearish triangle remain in play on the Nikkei which targets 24,500, yet the index remains within a countertrend move. For the triangle target to remain valid then prices must not close back above the lower trendline of the pattern.
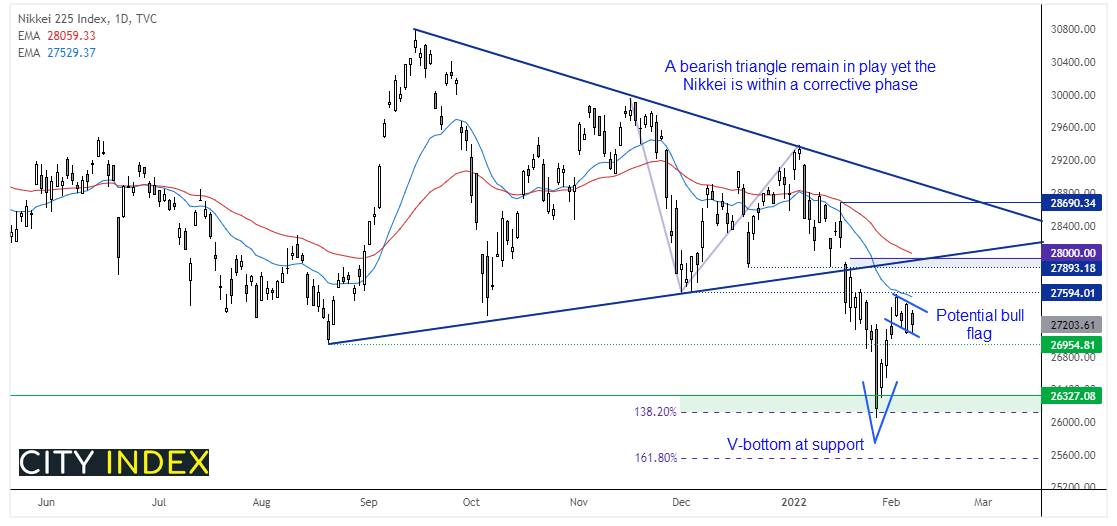
However, the ‘V-bottom’ which occurred just above 26k does warrant caution of bearish as they can also mark significant lows. The daily chart is also consolidating into a potential bull flag pattern, so are on guard for another leg higher as part of this corrective move. Should bulls lose control and prices break beneath the August low of 26,954 then we will assume momentum has realigned with the bearish triangle breakout. Whereas a break above 27,595 confirms the bull-flag breakout, clears the December low and 20-day eMA and assumes its next leg higher. 28k and the lower trendline would become bullish targets and how prices react around the trendline could prove pivotal for the Nikkei’s next directional move.
Read our guide on the Nikkei 225 trading guide ;
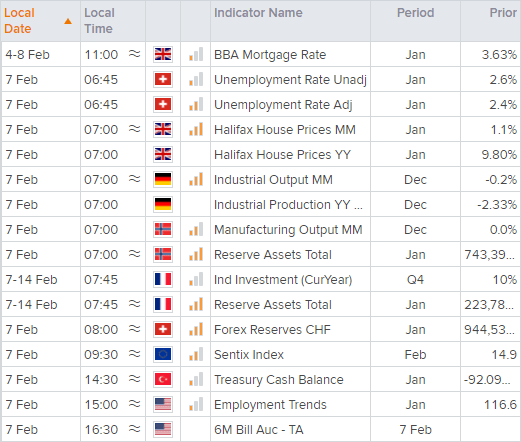
Calendar events this week for Japan
Growth is expected to have risen by 5.8% y/y in Q4 according to a Reuters poll, to more than offset the 3.6% contraction in Q3. The main driver behind the forecast is private consumption’s 2.2% rise, as it accounts for over half of Japan’s GDP. However, growth is currently expected to contract in Q1 due to the covid restrictions. GDP is released next week on Tuesday 15th February.
Household spending is released tomorrow at 8:30 JST and expected to rise a mere 0.3%. Whilst that doesn’t sound like much it would its first expansion in five months. Given its close proximity to zero alongside covid restrictions, we are on guard for a contraction here too. Bank lending is expected to rise 0.4% y/y ad is released alongside trade data at 08:50 JST.
Preliminary machine tool orders are released on Wednesday and can provide a forward look at growth. Given they have steadily declined since peaking back in June 2021 then it also plays in to the weaker growth narrative.
Then on Thursday producer prices (corporate goods prices) are released. They reached a near-record high of 8.5% in December but forecast to soften to 8.2% in January.
How to trade with City Index
You can easily trade with City Index by using these four easy steps:
-
Open an account, or log in if you’re already a customer
• Open an account in the UK
• Open an account in Australia
• Open an account in Singapore
- Search for the company you want to trade in our award-winning platform
- Choose your position and size, and your stop and limit levels
- Place the trade
Latest market news
Yesterday 01:32 PM
Yesterday 09:35 AM
Yesterday 07:23 AM
Yesterday 04:48 AM
Yesterday 12:17 AM
July 25, 2024 10:39 PM
Latest Indices articles

July 25, 2024 01:30 PM

July 25, 2024 01:01 AM

July 25, 2024 12:41 AM

July 24, 2024 07:26 PM