


At the start of the new week, US index futures have edged a little lower ahead of the open, following a mixed performance in Europe. The S&P 500 was essentially flat on Friday after its initial drop – on the back of stronger jobs and wages data – was bought. The US benchmark index is testing a major technical zone as investors look forward to the FOMC meeting next week.
The key focus on investors minds is what kind of message will the Fed deliver to the market at its highly anticipated rate decision next week. The markets have concluded that the pace of tightening will slow down to 50 basis points. The Fed is then likely to continue hiking at a slower pace a few more times before pausing to give time for the higher rates to work their way through the economy to create a soft landing and in order to cool inflation.
Friday’s jobs report initially caused a rethink as wages grew by 0.6% month-on-month, which was double the expected figure. This raised speculation that – because of the higher wage inflation – the Fed might pause at a higher terminal rate than expected. But traders were not very convinced, and the rate futures curve stopped climbing to levels seen in November.
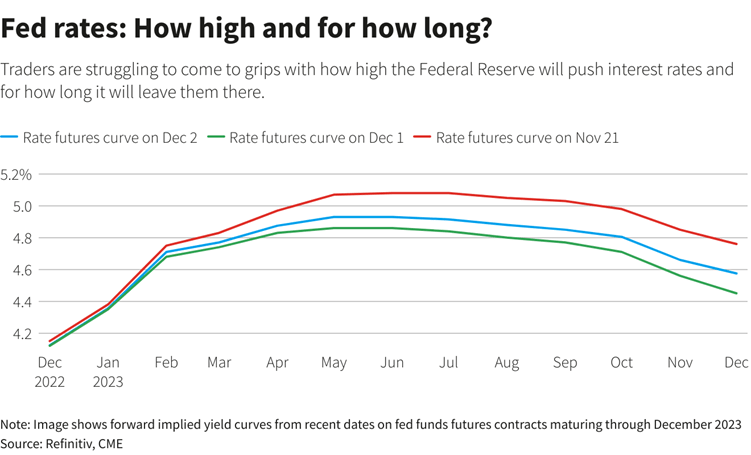
Source Reuters
The fact that the implied curve shows lower rates beyond the summer means investors are expecting the Fed to make a U-turn on its rate hikes, as it will probably be battling against a potential recession then.
The stronger wages data came after Powell’s somewhat dovish comments earlier in the week had sent risk assets soaring. So that may be a reason why investors sold the dollar and bought the dop in stocks after the initial move on Friday.
But let’s not get too ahead of ourselves just yet and remember that the Fed’s policy remains in contractionary mode for now. What’s more, the market may have now fully priced in a 50-basis point rate hike for December and the reduced tightening pace thereafter. This may therefore keep a ceiling on stock prices. Fears over a looming recession may also discourage investors from piling further into the stock markets after what has been a very impressive recovery in the last couple of months or so.
For now, though, there are no concrete technical signals to suggest markets are going to drop, although the S&P has entered a key juncture here:
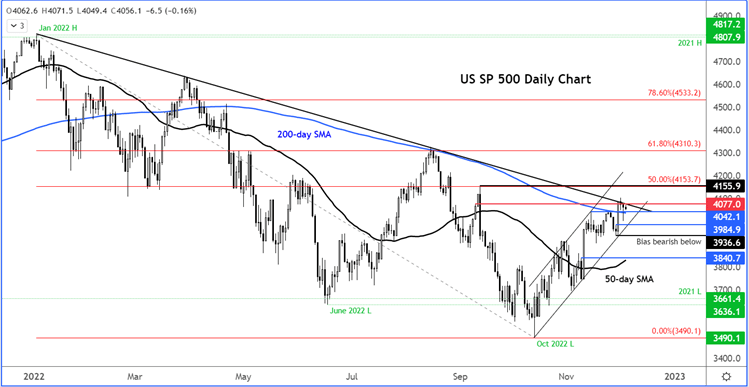
On Friday it closed right underneath the bearish trend line for the second consecutive day. The trend line which connects the previous highs seen this year comes in around 4075 to 4080. This is now the pivotal area for the market. The previous week’s high is at 4042, which is also roughly where the 200-day moving average comes into play. This level has so far been defended by the bulls. But a decisive move below here would pave the way for a re-test of the support trend of the bull channel around 4985.
For as long as the S&P holds above any of these levels, the bulls will remain happy. The shallower the pullback, the better the odds of the market moving further higher.
The bears, meanwhile, will need to defend this bearish trend line and push the market back below the 200-day, if they want to keep this year’s bearish trend intact now that we have moved into the final month of the year.
While aggressive bearish traders might be looking for trades around this trend line, the more conservative bears will want to see the breakdown of the bullish channel for confirmation now – especially in light of the big recovery. The 3936 level is now the line in the sand. A potential move below here in the coming days would invalidate the bullish trend of recent higher highs and higher lows.
How to trade with City Index
You can trade with City Index by following these four easy steps:
-
Open an account, or log in if you’re already a customer
• Open an account in the UK
• Open an account in Australia
• Open an account in Singapore
- Search for the company you want to trade in our award-winning platform
- Choose your position and size, and your stop and limit levels
- Place the trade
Latest market news
Yesterday 01:32 PM
Yesterday 09:35 AM
Yesterday 07:23 AM
Yesterday 04:48 AM
Yesterday 12:17 AM
July 25, 2024 10:39 PM
Latest Trade Ideas articles

Yesterday 09:35 AM

Yesterday 12:17 AM

July 25, 2024 10:39 PM

July 25, 2024 05:30 PM