


- S&P 500 analysis: Is the tech-fuelled rally and AI optimism overdone?
- Tesla falls 10%, IBM rises 10% after their earnings results
- US GDP beats expectations as focus turns to inflation data
- S&P 500 technical analysis indicates market is reaching ‘overbought’ territory

US stock markets opened higher with Nasdaq up 0.5% and S&P up 0.2% shortly after the cash open, both holding near Wednesday's record highs. US GDP for the fourth quarter was stronger than expected, while jobless claims jumped to provide a mixed session for data. In terms of individual movers, Tesla’s shares fell 10% but IBM was up by similar margin post earnings at the time of writing. Investors are wary of rising oil prices, and the market’s inability to hold onto its gains late in the day on Wednesday. So, the key question today is whether we are near at least a temporary peak in the ongoing phase of the rally, or if we persist in moving forward despite apprehensions about valuations, the developments in the Red Sea, and the postponement of interest rate cuts.
Tesla falls 10%, IBM rises 10%
The S&P 500 reached four consecutive record highs within a span of four days. However, on Wednesday, the rally encountered some challenges towards the end of the day, leading the major indices to relinquish all or a significant portion of their earlier gains. Despite Tesla's disappointing earnings, which dampened the enthusiasm in the tech sector, index futures rose slightly along with a rebound in European markets that had initially shown weakness, leading to a positive open on Wall Street. Tesla cautioned about "notably lower" sales growth before the introduction of its new model next year. Its shares fell as much as 10% shortly after the open, albeit better results from IBM meant concerns about the tech sector were contained.
US GDP beats expectations as focus turns to inflation data
Investors will be eyeing the core PCE price index, the Fed’s favourite inflation measure, due on Friday, ahead of the FOMC meeting and nonfarm payrolls report on Friday. Earlier, the ECB’s unchanged rate decision surprised no one, as Lagarde re-iterated that the central bank is data-dependant and not date-dependant when it comes to the timing of the first rate cut. However, she still stood by her comments made to Bloomberg that the rate cut could come in the summer instead of spring. Meanwhile, a slew of US data showed mixed signals about the world’s largest economy. GDP was much better at +3.3% in Q4 on an annualised format, compared to 2.0% expected and 4.9% in Q3. GDP deflator was +1.5% q/q, which was weaker than +2.3% expected, pointing to falling price pressures. But jobless claims jumped by 25K applications, which was more than expected.
Tesla aside, we had seen some good earnings, especially Netflix and now IBM from the tech sector. Meanwhile, the GDP beat comes on the back of a string of better-than-expected data lately. Yesterday, for example, saw the Composite PMI of the manufacturing and services sector rise to its highest level since June. Among other US data releases that have beaten expectations lately, include retail sales and UoM’s consumer confidence survey. On top of this, China’s latest efforts to shore up its struggling equity markets also helped to boost investor confidence.
So, there are some valid reasons why investors have been optimistic. But are they overly optimistic in these economic times? Can they justify buying equities at these levels faced with uncertain macro backdrop?
S&P 500 analysis: Is the tech-fuelled rally and AI optimism overdone?
After the exuberance of a dovish rate-cut that drove stocks to record highs in the final month of 2023, one might have anticipated a correction in the markets as expectations for the Fed's rate cuts were pushed back. While a modest correction did occur in the first week of the year, the markets have since continued to surge into uncharted territory, even as the likelihood of March rate cuts has diminished.
The market's resilience suggests that investors are content to see strength in US data despite elevated interest rates. They are confident that peak interest rates have been reached, and monetary policy will eventually loosen, albeit a bit later than initially expected.
However, sceptics argue that investors may be underestimating the risks they face. The escalating shipping costs due to the Red Sea situation are expected to elevate input costs, potentially leading to global inflation and further delays in interest rate cuts.
Another concern is the lack of participation from non-tech stocks, with Microsoft and Apple alone constituting 14% of the S&P 500. Any weakness in these or other major tech stocks could trigger a substantial correction in the S&P 500.
With Tesla's disappointing results, some investors are questioning whether stocks have been pushed too high, too quickly. The pace of the rally raises concerns, with some investors suggesting that the optimism around artificial intelligence could be a sign of irrational exuberance, particularly as many companies have yet to effectively monetize generative AI.
US investors also appear to be overlooking challenges in the Chinese markets and concerns about the health of the world's second-largest economy. Rising yields indicate fears that major central banks globally may not rush to cut interest rates. The ECB President conveyed concerns about inflation, suggesting that borrowing costs will not decrease before the summer, at the ECB’s press conference.
While US markets have soared on AI optimism and expectations of Fed rate cuts in 2024, there's a possibility that the rally could stall. Gold, FX, and bond market investors have already expressed concerns about the Federal Reserve's potential inclination to maintain higher interest rates beyond market expectations. The reliance on the top seven tech companies and AI optimism to drive equities to new highs poses a risk, and once this optimism fades, there's a potential for a correction from these overbought levels. A trigger for such a correction could be signs of persistent or rebounding inflation, with the Fed possibly delivering a more hawkish remarks next week than anticipated.
S&P 500 technical analysis: Key levels to watch
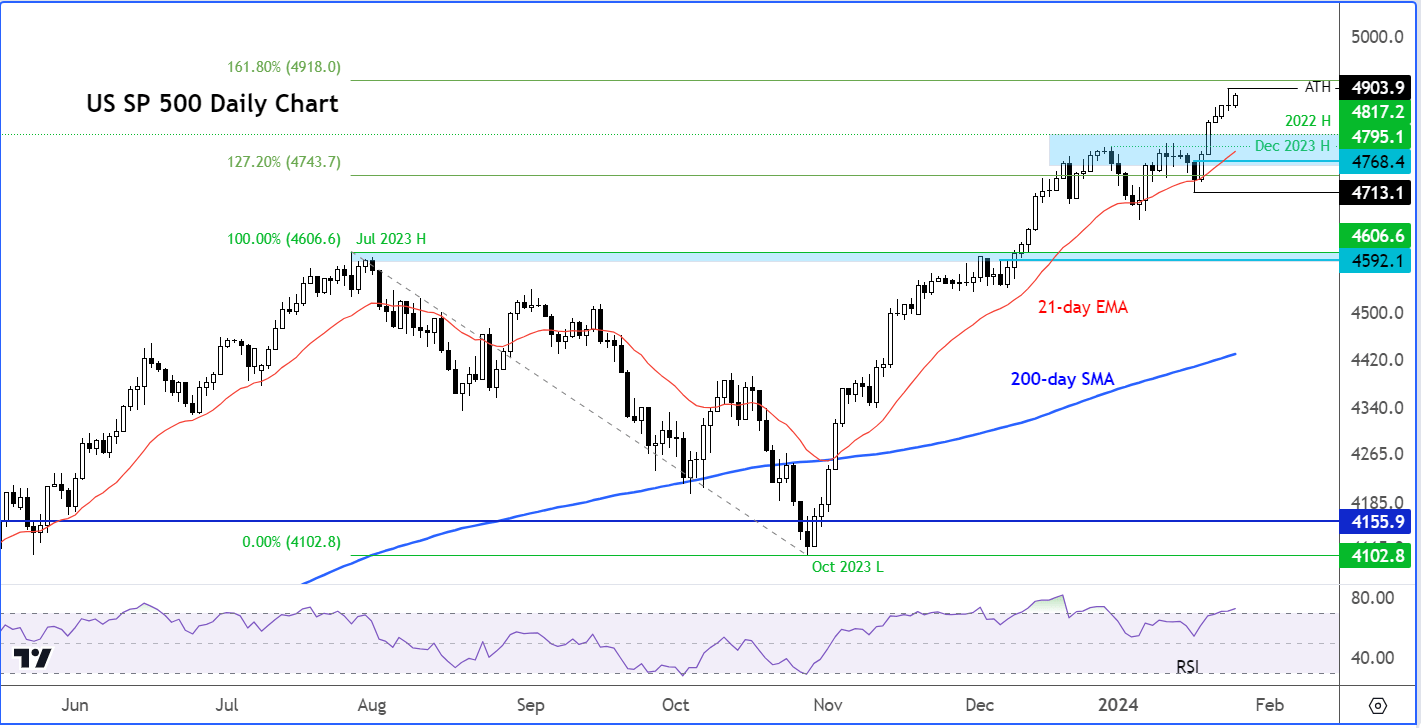
As the S&P and other major US indices attain successive all-time highs this week, the prevailing trend is undeniably bullish, and the markets are currently adhering to a "buy-the-dip" mentality, at least for the time being. However, there are signs that the rally may be stretching thin at these levels, as evident from sub chart of the S&P, showing the Relative Strength Index (RSI), which has reached the "overbought" threshold. So, there is the potential for some profit-taking around current levels.
The market's pattern of consistently achieving higher highs and higher lows implies that bearish investors are mostly on the side-lines, awaiting the emergence of a clear reversal pattern before actively participating. The small, inverted hammer candle observed on Wednesday might indicate a growing sense of caution among traders, especially in the aftermath of Tesla's disappointing earnings.
In the event of a market pullback, attention will likely focus on the shaded blue area on the chart, ranging from 4795 to 4817. This range corresponds to the previous two all-time highs reached in January 2022 and December 2023. Even if the market dips slightly below this zone, it may not necessarily be a negative signal or indicative of a peak. In fact, many dip-buyers might be lurking to get onboard on any short-term dips.
However, a more significant concern would arise if there is a breakdown in the market structure of higher highs and higher lows. At the current market state, the low recorded last week at 4713 could serve as a critical threshold for many short-term bullish traders. A potential breach of this level would establish a lower low, providing an objective exit signal for the bulls. Consequently, only in such a scenario could one anticipate subsequent technical selling. Any interim weakness should be interpreted as a routine pullback commonly observed in a rising trend.
-- Written by Fawad Razaqzada, Market Analyst
Follow Fawad on Twitter @Trader_F_R
How to trade with City Index
You can trade with City Index by following these four easy steps:
-
Open an account, or log in if you’re already a customer
• Open an account in the UK
• Open an account in Australia
• Open an account in Singapore
- Search for the company you want to trade in our award-winning platform
- Choose your position and size, and your stop and limit levels
- Place the trade
Latest market news
Yesterday 01:32 PM
Yesterday 09:35 AM
Yesterday 07:23 AM
Yesterday 04:48 AM
Yesterday 12:17 AM
July 25, 2024 10:39 PM
Latest Indices articles

July 25, 2024 01:30 PM

July 25, 2024 01:01 AM

July 25, 2024 12:41 AM

July 24, 2024 07:26 PM