


- S&P 500 analysis: Can the rally continue even as yields rise?
- Rising crude oil prices pose additional risk to inflation outlook
- S&P 500 technical analysis shows potential crack in bullish trend
S&P 500 analysis: rising yields and oil prices test bulls’ conviction
US index futures were a touch in the negative territory at the time of writing, ahead of the US cash open. The likes of the Dow and S&P retreated sharply after hitting fresh record highs in the first trading day of the month and quarter on Monday. The mini reversal came amid renewed concerns about inflation and profit-taking following the massive gains in the last two quarters. Hopes that the Fed and other central banks would ease interest rates and the hype over AI caused the S&P to rise about 28% from its lows in October. Following such a big move, the risks of a correction are high, especially when you consider for example that US oil prices are pushing $85 per barrel and governments are facing rising cost of servicing their debt as yields climb, making it increasingly difficult to continue borrowing without raising the debt-to-GDP ratios to alarming levels. So far in 2024, these worries and concerns about over-stretched valuations have been shrugged off by investors. Let’s see if that changes as we start Q2 and head deeper into 2024. Bearish speculators still need to see a confirmed reversal signal of the charts given the strength of the rally in the past 5 months or so.
What has caused yields to rise again?
The US 10-year yields rose 10 basis points on Monday, before climbing further in the first half of Tuesday’s session as WTI crude oil prices climbed above $85.00 per barrel. Monday’s moves in yields were triggered by economic data from the world’s largest economies as purchasing managers in both Chinese and US industries reported growth in activity, which surpassed expectations. However, the US ISM manufacturing PMI also raised inflation worries as the prices sub index jumped to 55.8 from 53.3, sending bond yields higher and further reduced the prospects of aggressive rate cuts. The data caused commodities like crude oil to rally as it further alleviated growth concerns. Today, WTI surpassed the $85, further fuelling inflation worries.
What to expect this week?
Looking ahead of the rest of the week, Federal Reserve speeches scheduled for this week are in double digits, and the market may anticipate Monday’s manufacturing data to instil caution among officials regarding substantial policy easing. Additionally, numerous jobs reports are expected throughout the week, with Friday's non-farm payrolls figures and unemployment rate being the highlights. As a result, trading could be volatile in the week ahead. I guess for stock market bulls, any signs of a soft landing would be welcome as that will keep the prospects of a rate cut in June alive. The bears will want to see further evidence of sticky inflation.
S&P 500 analysis: technical factors and levels to watch
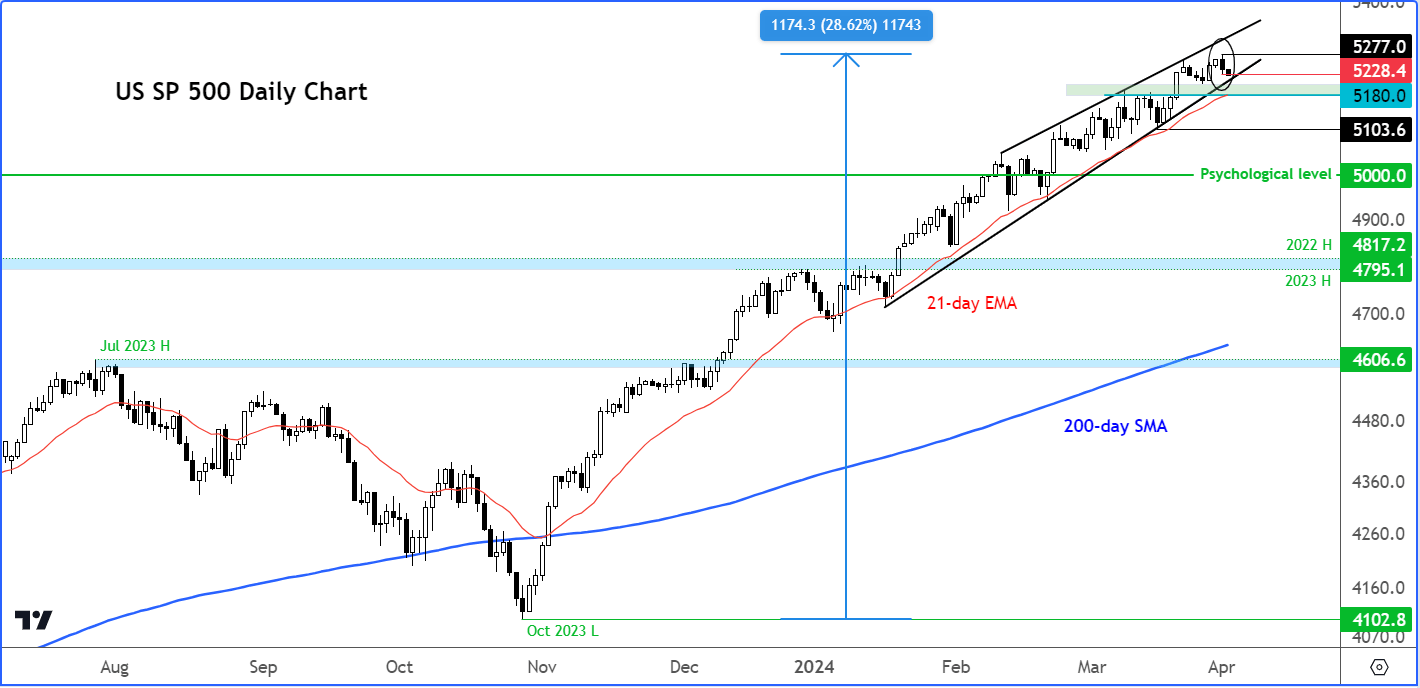
Source: TradingView.com
Stocks have been on a blinder for the last three months, thanks to AI optimism and everyone feeling positive about potential interest rate cuts by the Federal Reserve, and other major central banks, later in the year. Since late October, the S&P 500 has shot up about 28%, but there's some worry that the market is a bit exposed to some short-term profit-taking.
On Monday, the S&P 500 chart printed a small bearish-engulfing candle on the daily time frame, which meant that the small gains from the last trading of last week (Thursday) were wiped out and some. What we will need to watch out for today is to see whether there will be further downside momentum after that bearish shift, or we go back inside Monday’s range. The bears will want to see some real commitment this time, as their past attempts to trigger a correction have been futile.
Even if we see a small pullback, the bears will still need to see further evidence of a market top. For example, a break from the rising channel or wedge would be needed. Key short-term support comes in at around 5180, where the 21-day exponential moving average also comes into play. If this level breaks, only then will things turn a bit interesting. Otherwise, it is likely to be more of the same: minor dips being bought. Interesting, the S&P it hasn't experienced even a 2% pullback during its melt up since November, underscoring the strength of the ongoing rally.
-- Written by Fawad Razaqzada, Market Analyst
Follow Fawad on Twitter @Trader_F_R
How to trade with City Index
You can trade with City Index by following these four easy steps:
-
Open an account, or log in if you’re already a customer
• Open an account in the UK
• Open an account in Australia
• Open an account in Singapore
- Search for the company you want to trade in our award-winning platform
- Choose your position and size, and your stop and limit levels
- Place the trade
Latest market news
Yesterday 01:32 PM
Yesterday 09:35 AM
Yesterday 07:23 AM
Yesterday 04:48 AM
Yesterday 12:17 AM
July 25, 2024 10:39 PM
Latest Indices articles

July 25, 2024 01:30 PM

July 25, 2024 01:01 AM

July 25, 2024 12:41 AM

July 24, 2024 07:26 PM