


February 9, 2022 8:44 PM

Out of the 4 major US Indices (SPX 500, Nasdaq 100, DJIA, Russell 2000), the Russell 2000 performed the worst on the since falling from all-time highs in November 2021. The small cap stock index fell into bear market territory , down over 22.5% from its all-time highs. Thus far, the Russell 2000 has regained 9.5%. See the chart below for comparison:
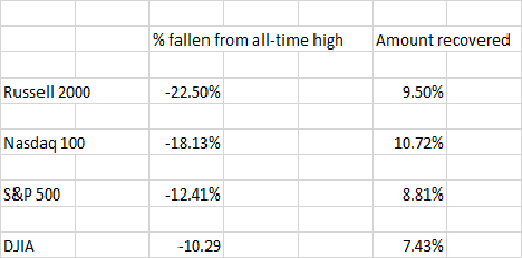
Source: Stone X
Trade the Russell 2000 now: Login or Open a new account!
• Open an account in the UK
• Open an account in Australia
• Open an account in Singapore
The Russell 2000 had been trading in a range between 2100 and 2360 for nearly all of 2021. In early November 2021, the small cap index broke above the channel and reached an all-time high of 2458.85 before reversing and moving back into the range. The Russell 2000 traded down to 2144.32 and bounced. This set up an AB=CD pattern (which was complete on January 27th). As is often the case, what happens on a false breakout on one side of a channel happens on the other side of the channel. Price eventually broke lower below the bottom channel line on January 19th and traded down to 1901.36, before bouncing. However, whereas the other indices have retraced AT LEAST to the 38.2% Fibonacci retracement from their all-time highs (the S&P 500 and DJIA are at their 61.8% Fibonacci retracement), the Russell 2000 has yet to come close to it yet.
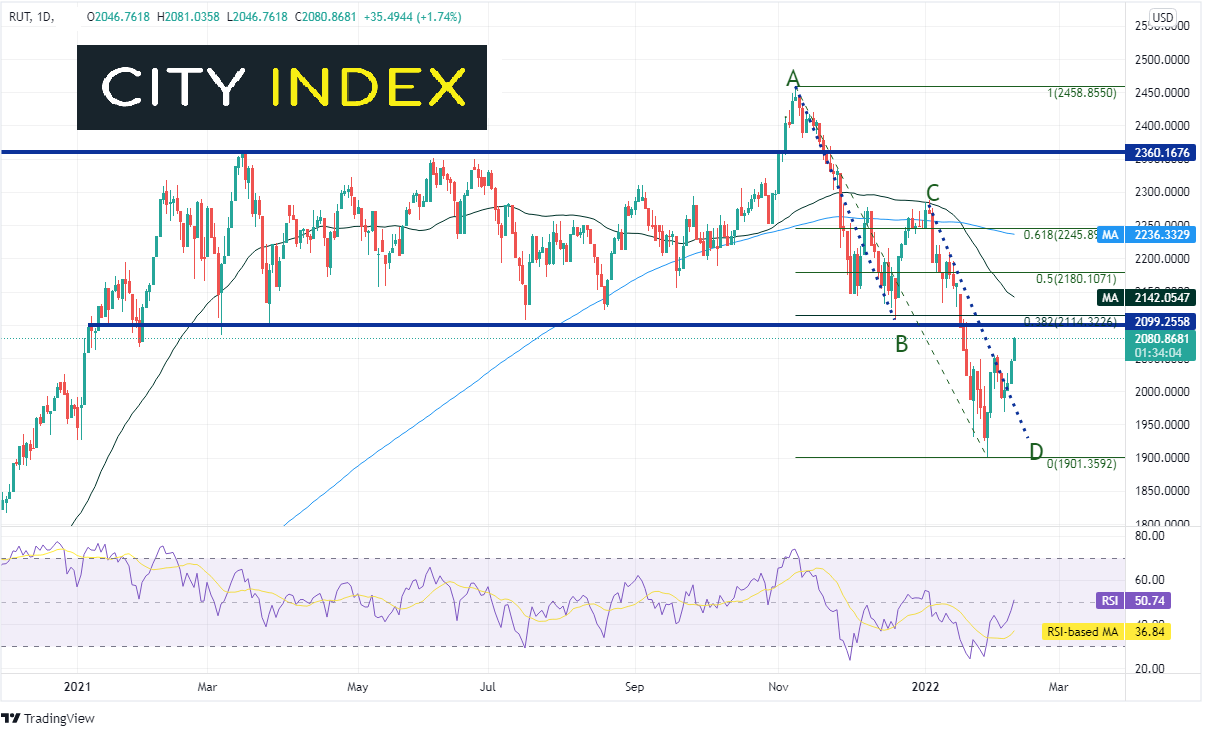
Source: Tradingview, Stone X
On a 240-minute timeframe, the AB=CD pattern is much clearer. Currently, the Russell 2000 is about to be tested as it closes in on a confluence of resistance at the bottom trendline of the long-term, horizontal channel and the 38.2% Fibonacci retracement level from the highs of November 2021 to the recent lows of January 28th at 2099.25 and 2114.32, respectively. Above there, resistance is at the 50% retracement level from the same timeframe at 2180.11, and then another confluence of horizontal resistance and the 61.8% Fibonacci retracement level near 2237/2246. Horizontal support is at 2054.72. Below there, price can fall to the February 4th lows at 1968.60 and then the January 28th lows at 1901.36.
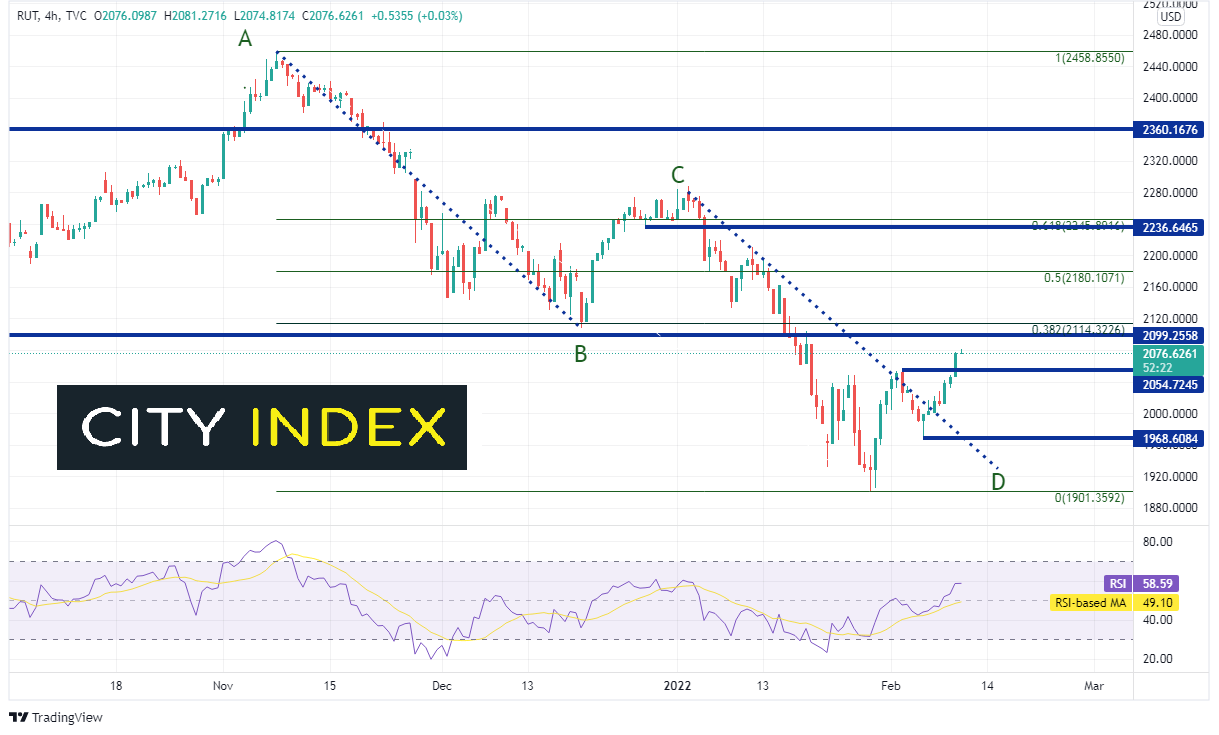
Source: Tradingview, Stone X
If the Russell 2000 wants to play catch up to its peers in terms of market recovery, it will need to at least retake the 50% retracement from its all-time highs to recent lows. Thus far, it hasn’t come close. Therefore, if markets resume the recent trend lower, the Russell 2000 is likely to lead the way!
Learn more about forex trading opportunities.
Latest market news
Yesterday 01:32 PM
Yesterday 09:35 AM
Yesterday 07:23 AM
Yesterday 04:48 AM
Yesterday 12:17 AM
July 25, 2024 10:39 PM
Latest Trade Ideas articles

Yesterday 09:35 AM

Yesterday 12:17 AM

July 25, 2024 10:39 PM

July 25, 2024 05:30 PM