


January 19, 2023 5:33 PM

The Philadelphia Fed Manufacturing Index for December was -8.9, better than both the expectation (-11) and the December reading (-13.7), but still negative, nonetheless. This marks the fifth consecutive negative reading for the regional manufacturing index and the seventh negative reading over the past eight months! The Employment component rose from -0.9 to 10.9 while the New Orders component rose from -22.3 to -10.9. However, it was the Prices Paid component that seems to reflect most in the Manufacturing data as it fell from 36.3 to 24.5. This was the lowest reading for the inflation component since August 2020.
Although the Philly Fed Manufacturing Index is still negative, it is much better than the NY Empire State Manufacturing Index released earlier this week. The headline reading for the NY Manufacturing Index was -32.9 vs an expectation of -9 and a December reading of -11.2. This was the lowest reading since May 2020 and the fifth worst reading ever. The New Orders component tanked (-31.1 vs -3.6 prior) as did the shipments component (-22.4 vs 5.3 prior). Still to come next week are the Richmond Fed Manufacturing Index and the Kansas Fed Manufacturing Index, however these two aren’t regarded as highly Philadelphia and NY.
Today’s data had little effect on the US Dollar as markets try to decipher whether this means that the Fed will be more hesitant to raise rates moving forward or if this means a recession lies ahead. The price of the US Dollar Index is nearly unchanged over the last 5 trading sessions near 102.24. However, notice that the DXY is sitting at key support near the 61.8% Fibonacci retracement level from the lows of 2022 to the highs of 2022 at 102.34. The index also sits just above horizontal support from May 30th at 101.30. Watch to see if the DXY can move back up towards resistance at the January 12th highs of 103.29.
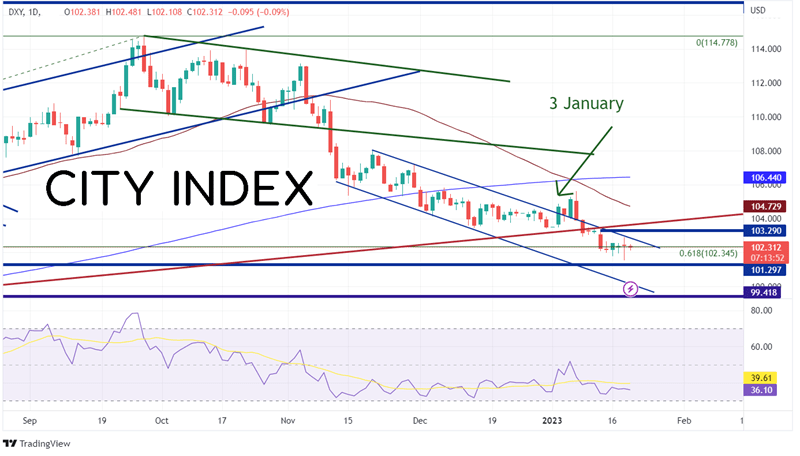
Source: Tradingview, Stone X
Trade the DXY now: Login or Open a new account!
• Open an account in the UK
• Open an account in Australia
• Open an account in Singapore
However, the S&P 500 is responding negatively to the worse than expected data over the last few days. The large cap index held below a trendline dating to early January 2022. Yesterday, it also fell below the 200 Day Moving Average and the 50 Day Moving Average. After today’s data release, the S&P 500 fell below horizontal support at 3898.6. This opens up room for a possible move down to the low of December 22nd, 2022 at 3763.4 and the 61.8% Fibonacci retracement level from the lows of October 13th, 2022 to the highs of December 13th, 2022 at 3738.1. Below there, price can fall all the way to the October 13th, 2022 low at 3489.
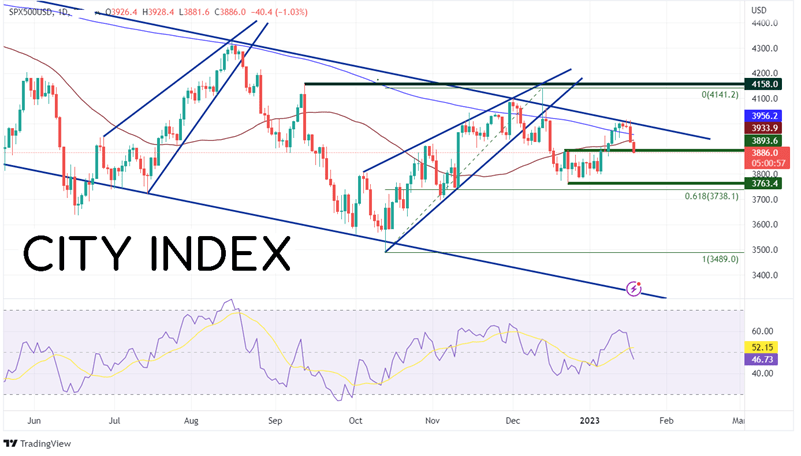
Source: Tradingview, Stone X
Trade the S&P 500 now: Login or Open a new account!
• Open an account in the UK
• Open an account in Australia
• Open an account in Singapore
The manufacturing data for December released over the last few days has not been good for the US Dollar and has been bad for the S&P 500. If the data continues to be worse, will the US Dollar continue to be uninfluenced by it? And will bad data now be bad for stocks on recession fears? Watch the key support levels in both assets.
Learn more about forex trading opportunities.
Latest market news
Yesterday 01:32 PM
Yesterday 09:35 AM
Yesterday 07:23 AM
Yesterday 04:48 AM
Yesterday 12:17 AM
July 25, 2024 10:39 PM
Latest Trade Ideas articles

Yesterday 09:35 AM

Yesterday 12:17 AM

July 25, 2024 10:39 PM

July 25, 2024 05:30 PM