


June 7, 2022 7:42 PM

Demand for Natural Gas is high as countries seek alternatives for crude oil, especially in Europe where the EU has placed an embargo on Crude Oil from Russia. This has been pushing the price of Natural Gas higher. However, it’s not only in Europe where the demand is high. In the US, the weather is predicted to be hotter than usual in the south. This will also increase demand for the product. Not to mention that its driving season and overall demand for energy is high. In addition, China is reopening, which will further add to the demand of energy. As prices of oil and oil alternatives move higher, the price of Natural Gas will rise as well.
What is Natural Gas and how do you trade it?
On a daily timeframe, the price of Natural Gas reached an all-time new high today at 9.461. The commodity is trading in an upward sloping channel. Although price is diverging with the RSI, one shouldn’t be concerned about it until the RSI moves into overbought territory. When an instrument is moving into all-time new high territory, the RSI is of little use and it can just continue to move higher and higher.
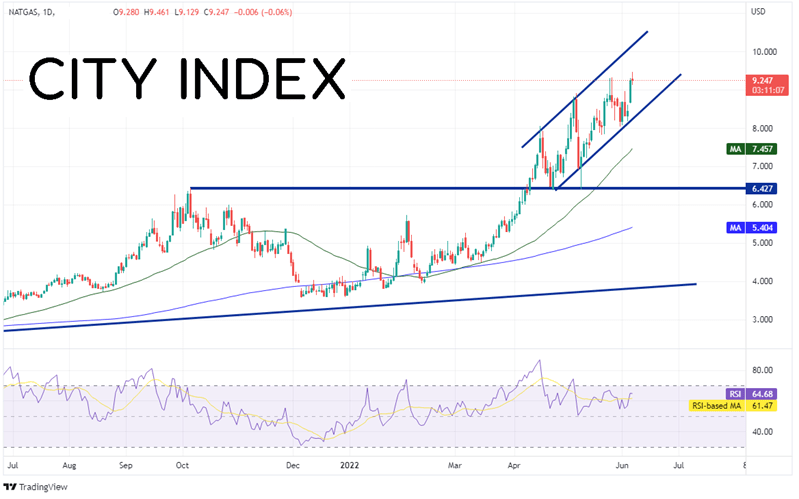
Source: Tradingview, Stone X
Trade Natural Gas now: Login or Open a new account!
• Open an account in the UK
• Open an account in Australia
• Open an account in Singapore
On a 240-minute timeframe, Natural Gas has formed an inverted head and shoulders formation near the bottom, upward sloping trendline of the long-term channel. The target for an inverse head and shoulders is the height from the neckline to the head, added to the breakout point. In this case it is near 9.69. This is just above the first resistance (after today’s high) at the 127.2% Fibonacci extension from the high of May 26th to the low of May 31st at 9.667. Above there, price can move aggressively to the psychological round number resistance level at 10.000 and then a confluence of resistance at the 161.8% Fibonacci extension from the recently mentioned timeframe and the top trendline of the upward sloping channel, near 10.112.
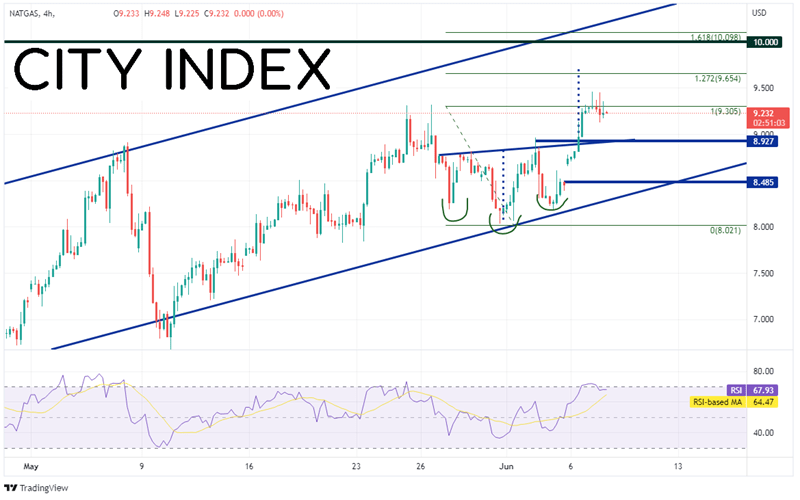
Source: Tradingview, Stone X
First support is at the highs from June 2nd and the neckline of the inverse head and shoulders pattern near 8.927. Below there, price can drop to the gap fill from June 3rd near 8.485 and then the bottom trendline of the upward sloping channel near 8.28.
Natural Gas prices have been on the rise since March. However, prices have recently turned aggressively higher as demand for oil alternatives has picked up, especially in Europe. The commodity continues to put in new highs and may very well be on its way to the psychological round number resistance at 10.000!
Learn more about commodity trading opportunities.
Latest market news
Yesterday 01:32 PM
Yesterday 09:35 AM
Yesterday 07:23 AM
Yesterday 04:48 AM
Yesterday 12:17 AM
July 25, 2024 10:39 PM
Latest Trade Ideas articles

Yesterday 09:35 AM

Yesterday 12:17 AM

July 25, 2024 10:39 PM

July 25, 2024 05:30 PM