


May 3, 2022 7:27 PM

As Europe tries to pullout of its reliance on Russia for energy, demand for Natural Gas from other areas of the world has increased. In addition, with the summer months approaching in the northern hemisphere, there will be more demand. However, there are fears that supply won’t be able to keep up. As a result, natural gas prices reached all time new highs today and price jumped over 8%.
What is natural gas and how do you trade it?
On October 26th, 2021, Natural Gas had made new highs at 6.427 and pulled all the way back to 3.572 by early December 2021. Price then began moving higher once again and on April 11th, it took out the previous highs. Price rose in parabolic fashion as it became more and more apparent that Europe would try to reduce, and eventually discontinue, its reliance on Russian energy. Natural Gas prices halted just below the 161.8% Fibonacci extension from the highs of October 6th, 2021 to the low of December 6th, 2021, at 8.057. At the time, the RSI was overbought near 86.50. RSI readings above 80 are considered overbought and price should be watch for a pullback. Natural gas prices did indeed pullback as the RSI moved back into neutral territory, however, price held the prior highs at 6.427 on April 25th. Since then, price has been on the move and today, price reached a new all-time high of 8.083. First resistance above the new high is the prior mentioned 161.8% Fibonacci extension at 8.191.
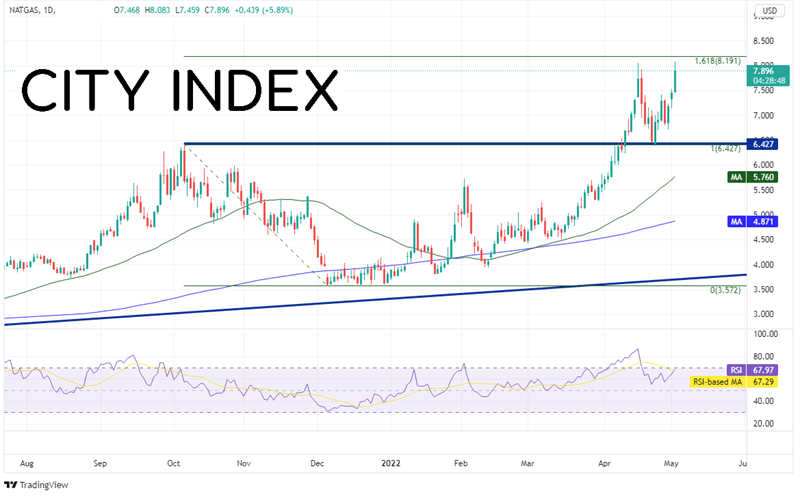
Source: Tradingview, Stone X
Trade Natural Gas now: Login or Open a new account!
• Open an account in the UK
• Open an account in Australia
• Open an account in Singapore
On a 240-mintute timeframe, Fibonacci extension levels from the high of April 18th to the low of April 25th provide the next resistance levels. The 127.2% Fibonacci extension crosses at 8.518 and the 61.8% Fibonacci extension crosses at 9.10. However, notice that the RSI is diverging with price on the 240-minute timeframe, an indication price may be ready for a short-term pullback. First horizontal support is at 7.413. Below there, price can trade to the lows of April 29th at 6.721 then the low of April 24th at 6.379.
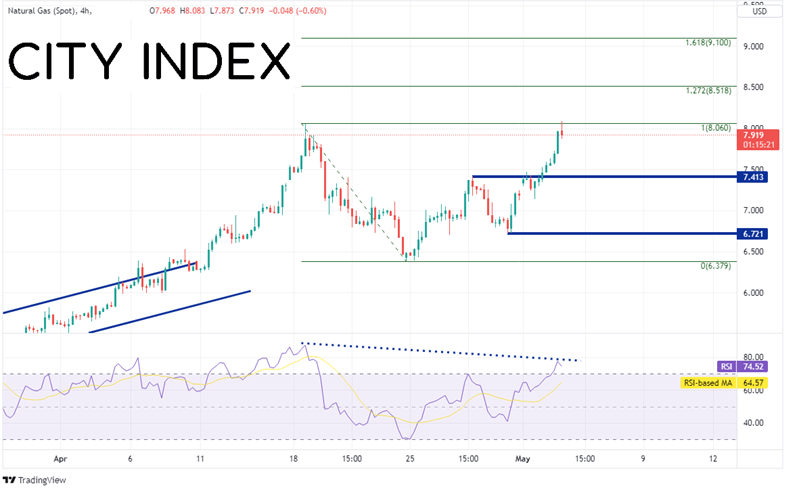
Source: Tradingview, Stone X
As Europe tries to rely less and less on Russia for its energy needs, the price of natural gas may continue to rise. Add in hotter temperatures, which increases both demand and worries about a possible lack of supply, and Natural Gas prices may remain high.
Learn more about commodity trading opportunities.
Latest market news
Yesterday 01:32 PM
Yesterday 09:35 AM
Yesterday 07:23 AM
Yesterday 04:48 AM
Yesterday 12:17 AM
July 25, 2024 10:39 PM
Latest Trade Ideas articles

Yesterday 09:35 AM

Yesterday 12:17 AM

July 25, 2024 10:39 PM

July 25, 2024 05:30 PM