


Key takeaways
- The Nasdaq has outperformed the S&P 500 this year so far at 27.4% versus the S&Ps 20.7% rally
- Markets are likely to remain responsive to debt ceiling headlines
- Whilst we anticipate the debt ceiling will likely be raised, it leaves the potential for indices to pull back from current cycle highs if debt talks drag on too long this week (which also seems likely)
- However, we’d prefer to seek bullish setups on the Nasdaq if the deal is struck, so we’re on guard for pullbacks towards support levels to identify potential swings
- We prefer to seek bearish setups on the S&P 500 if talks remain unconstructive
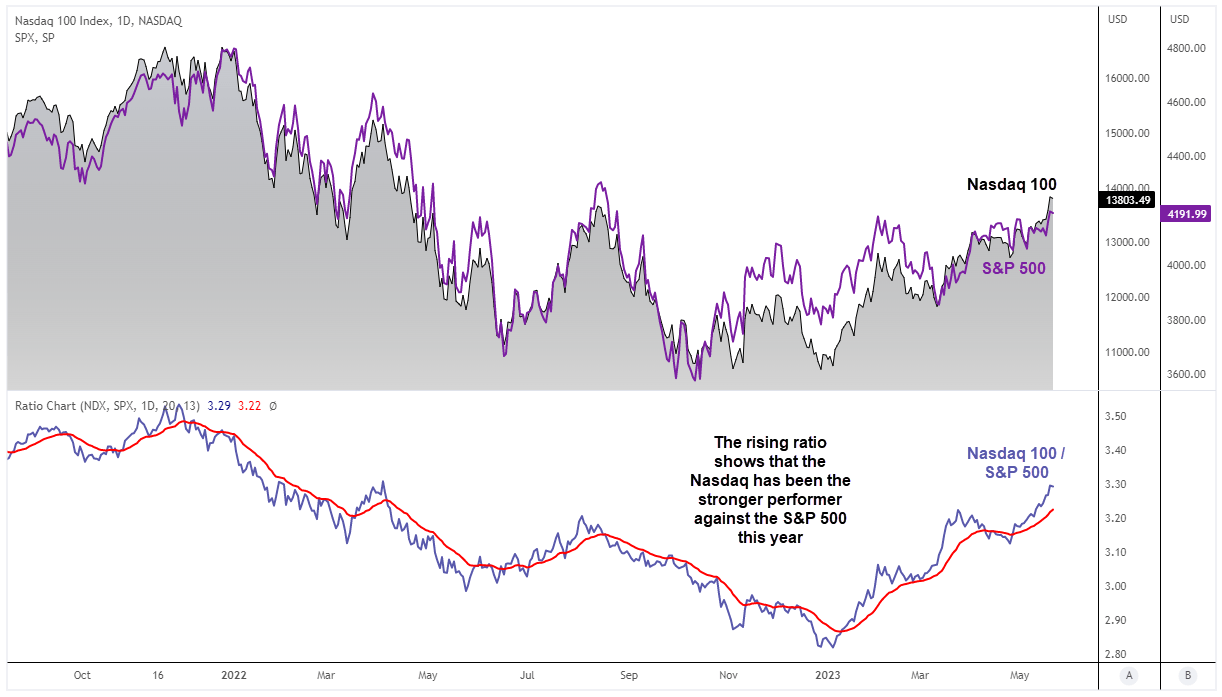
Nasdaq 100 / S&P 500 ratio chart
Whilst the major US indices tend to track each other quite closely over time, their performance can differ and there is usually a leader and a laggard. For example, the daily price action of the Nasdaq 100 and S&P 500 has moved in the same general direction, but the ratio chart shows that the Nasdaq has been the outperformer this year so far, following a period of underperformance in 2022.
The ratio chart is simply the Nasdaq divided by the S&P 500 (Nasdaq / S&P 500), and a rising chart shows the Nasdaq is the stronger market of the two even though both markets have been rising in tandem.
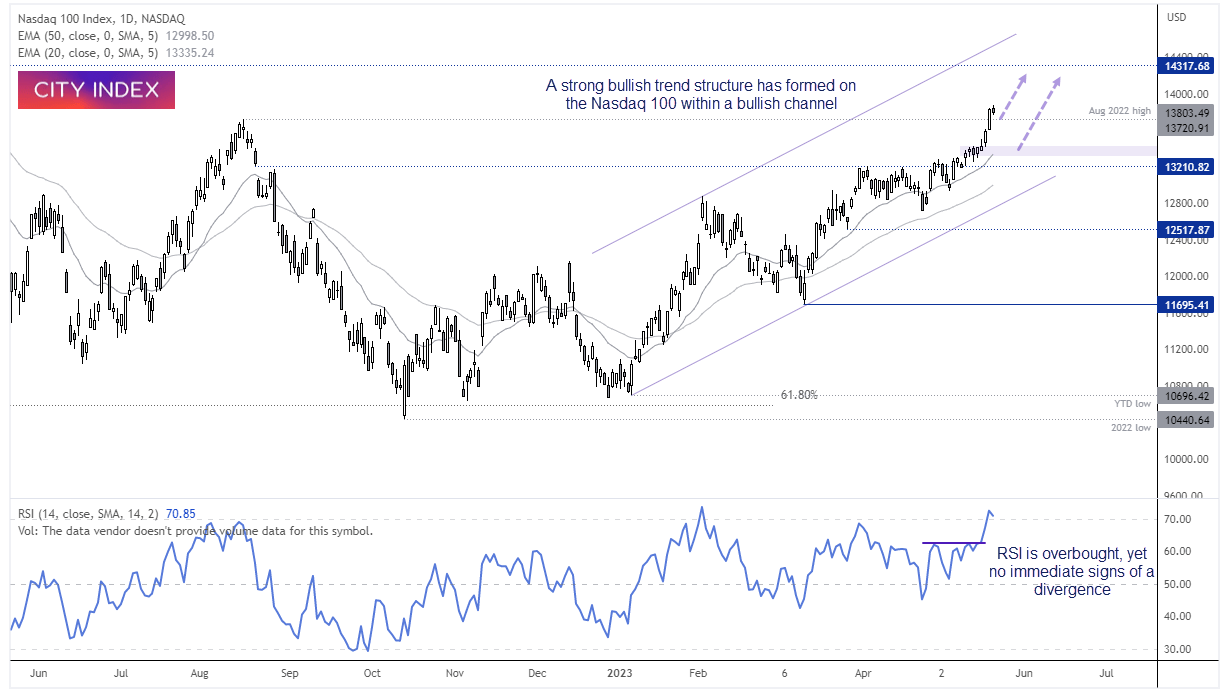
Nasdaq 100 daily chart
The daily trend structure on the Nasdaq 100 is firmly bullish, and it trades above the midpoint of a bullish channel. The higher lows are connected with clean rallies, and a 2-day range expansion on Wednesday ad Thursday broke prices out of a tight consolidation and closed above the August 2022 high. The 20 and 50-day EMAs are providing dynamic support and point higher with prices.
Whilst the RSI (14) is in the overbought zone, such ‘zones’ are really only of use during an oscillating market (as bullish prices force the RSI higher, so overbought is in fact a sign of strength). Furthermore, there is not yet a bearish divergence, therefore price action remain king.
From here we would like to see prices pull back and form a swing low, or at least consolidate near these highs for a few days before considering bullish opportunities. There is a real risk that debt ceiling talks will drag on and knock sentient lower and weigh on indices such as the Nasdaq, but as we suspect the debt ceiling will have to be raised then any such pullback could be seen as an opportunity for dip buyers.
And whilst we’d expect all indices to rally if or when a deal is struck, we’d prefer to seek bullish setups on the Nasdaq over the S&P 500 given its outperformance this year.
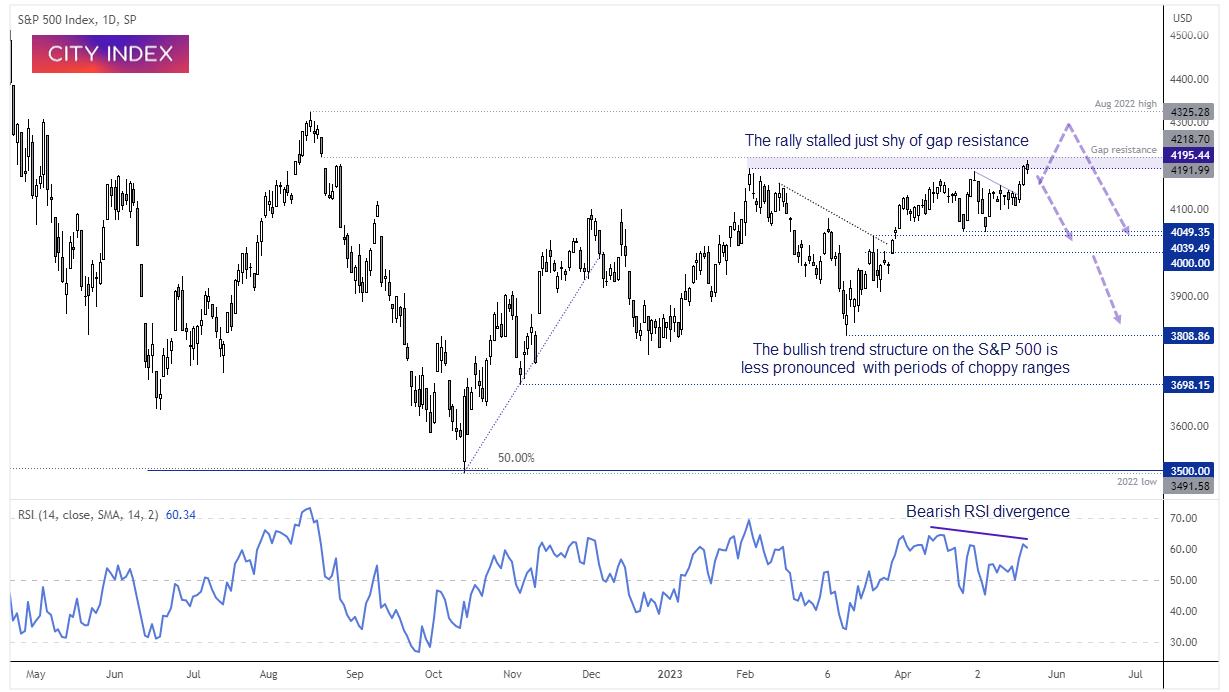
S&P 500 daily chart
The trend structure on the S&P 500 is less impressive on the daily chart compare with the Nasdaq 100, with choppy ranges, weak breakouts and reversals. Whilst we saw two decent days of range expansion out of compression last Wednesday and Thursday, the marked failed to push materially higher on Friday and failed to fully close the gap from August 19th 2022.
With the 4200/22 area holding as resistance, we see the potential for a move lower (especially if debt ceiling talks are unconstructive, which seems to be likely at least in the first half of this week). Should talks fall apart then we’d prefer to seek bearish opportunities on the S&P 500 over the Nasdaq and could see it falling towards (and likely below 4,000).
-- Written by Matt Simpson
Follow Matt on Twitter @cLeverEdge
How to trade with City Index
You can trade with City Index by following these four easy steps:
-
Open an account, or log in if you’re already a customer
• Open an account in the UK
• Open an account in Australia
• Open an account in Singapore
- Search for the market you want to trade in our award-winning platform
- Choose your position and size, and your stop and limit levels
- Place the trade
Latest market news
Yesterday 01:32 PM
Yesterday 09:35 AM
Yesterday 07:23 AM
Yesterday 04:48 AM
Yesterday 12:17 AM
July 25, 2024 10:39 PM
Latest Trade Ideas articles

Yesterday 09:35 AM

Yesterday 12:17 AM

July 25, 2024 10:39 PM

July 25, 2024 05:30 PM