


April 7, 2022 8:01 PM

Mexico CPI was released earlier with a March print of 7.45% YoY vs an expectation of 7.36% YoY and a February reading of 7.28% YoY. This was the highest CPI print for Mexico since January 2001. In addition, the Core CPI print was 6.78% YoY vs an expectation of 6.7% YoY and a February reading of 6.59%. This as the highest Core CPI reading since June 2001. Recall that when Banxico hiked rates from 5.5% to 6% on March 25th, it also raised its guidance on inflation. It now sees 2022 inflation at 5.8%, up from January’s forecast 4.9%. It also revised the 2023 outlook on inflation from 4.5% to 4.6%.
On weekly timeframe, USD/MXN has been trading lower in a descending triangle pattern since the pair made a pandemic high of 25.7836 in April 2020. Notice at the bottom of the triangle there is a strong support zone that USD/MXN held from November 2020 to September 2021, between 19.5491 and 19.7275. From there price bounced to the 38.2% Fibonacci retracement level from the April 2020 highs to the June 2021 lows, near 21.9612, however failed to close above it. Price continued lower and is currently testing the long-term support zone once again.
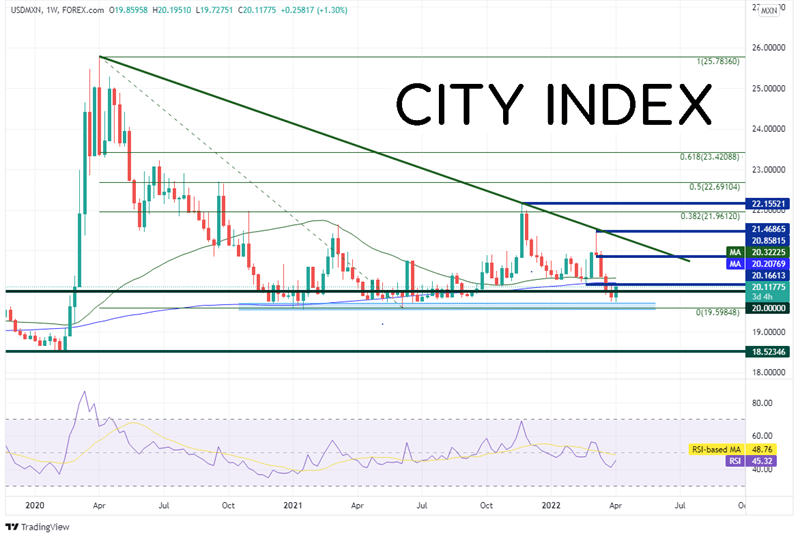
Source: Tradingview, Stone X
Trade USD/MXN now: Login or Open a new account!
• Open an account in the UK
• Open an account in Australia
• Open an account in Singapore
On a daily timeframe, USD/MXN tried to move highs again in late February and early March, however, price was stopped at the long-term downward sloping trendline, near 21.4687. Since then, price collapsed below both the 50- and 200- Day Moving Averages, and back towards the long-term support zone.
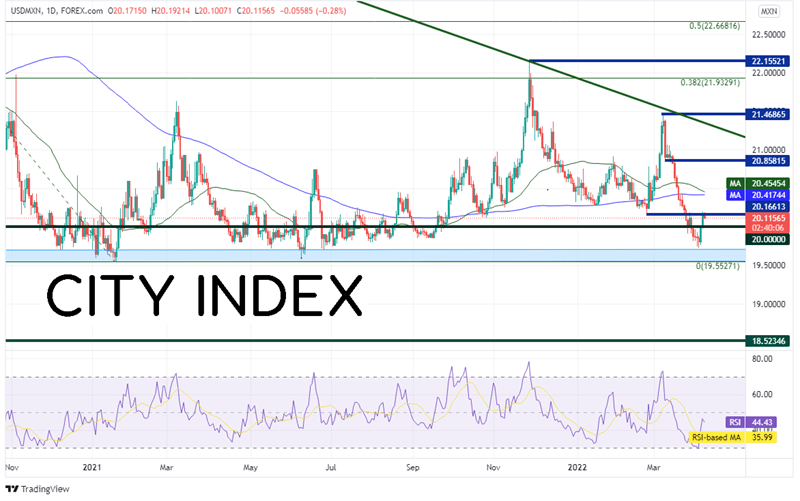
Source: Tradingview, Stone X
On a 240-minute timeframe, USD/MXN bounced off the support zone and was halted today at horizontal resistance near 20.1951. If price breaks above there, the next level of resistance is at the 38.2% Fibonacci retracement from the highs of March 8th to the lows of April 4th, near 20.3926, and then the convergence of the 50- and 200- Day Moving Averages between 20.4173 and 20.4539 (see daily). Support below is at the support zone between 19.5491 and 19.7275. Below there, the next level of horizontal support isn’t until 18.5235 (see weekly).
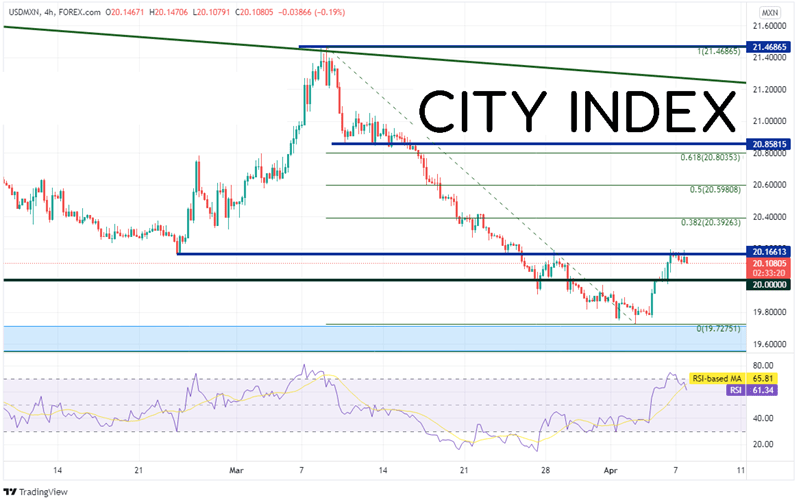
Source: Tradingview, Stone X
Mexico’s inflation continues to move to higher levels than the Bank of Mexico had anticipated. However, the USD/MXN is caught between a long-term support zone and the downward sloping trendline of a long-term descending triangle. For now, the pair is consolidating. However, when USD/MXN breaks out of either of these levels, it may move quickly!
Learn more about forex trading opportunities.
Latest market news
Yesterday 01:32 PM
Yesterday 09:35 AM
Yesterday 07:23 AM
Yesterday 04:48 AM
Yesterday 12:17 AM
July 25, 2024 10:39 PM
Latest Trade Ideas articles

Yesterday 09:35 AM

Yesterday 12:17 AM

July 25, 2024 10:39 PM

July 25, 2024 05:30 PM