


September 19, 2022 8:15 PM

USD/CAD reached its highest level since November 3rd, 2020 today as price continues to shoot higher, reaching an intra-day high today of 1.3344. However, is the pair ready to pull back? After a 220 pip move higher last week, USD/CAD is running into some resistance. Not only is the pair trading at the November 3rd, 2020 highs, but it is also trading right at the 50% retracement level from the pandemic highs of 1.4667 in March 2020 to the lows in May 2021, near 1.3339. In addition, USD/CAD is trading at the top trendline of an upward sloping channel that the pair has been in since March, near 1.3418.
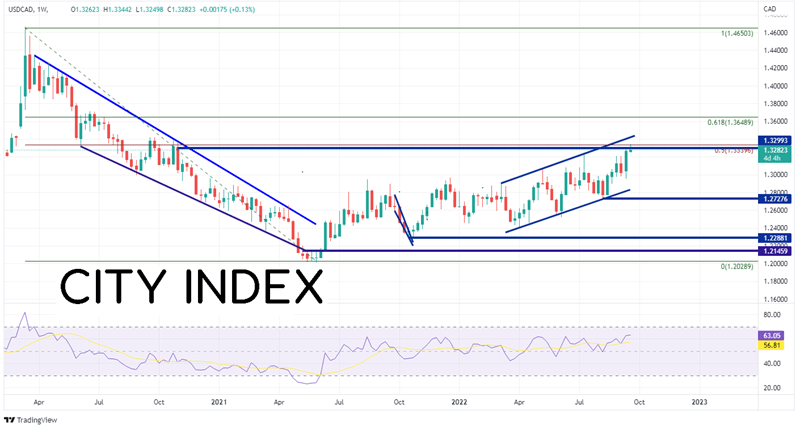
Source: Tradingview, Stone X
Your guide to the Canadian Dollar
With USD/CAD trading near all that resistance, what can help it to move lower? Canada releases its August CPI data Tuesday morning. Expectations are for an increase of 7.3% YoY vs a prior reading of 7.7% YoY. In addition, the Core CPI is expected to be 6.2% vs 6.1% in July. If either of these readings come in stronger than expected, USD/CAD may move lower. The US Federal Reserve also meets this week to discuss interest rate policy on Wednesday. If the Committee raises rates by less than 75bps or if it hikes with dovish comments, the US Dollar may move lower, dragging down USD/CAD with it.
Everything you need to know about the Federal Reserve
Technically, not only is USD/CAD trading with the above-mentioned resistance on the weekly timeframe, but there is also signs of pulling back on the daily timeframe. Today, price traded to just below the 127.2% Fibonacci extension from the highs of July 14th to the lows of August 11th, near 1.3359. This acts as the first resistance level (and confluences nicely with the 50% retracement level from the weekly timeframe near 1.3339). The next resistance level is the top trendline of the channel near 1.3418, then the 161.8% Fibonacci extension from the previously mentioned timeframe near 1.3530. In addition to the resistance, price has formed an inverted hammer, which indicates a possible reversal signal. If price does move lower, first support is at Friday’s low and the July 14th highs near 1.3224. Below there, price can fall to the lows of September 13th at 1.2954 and then the bottom trendline of the upward sloping channel near 1.2810.
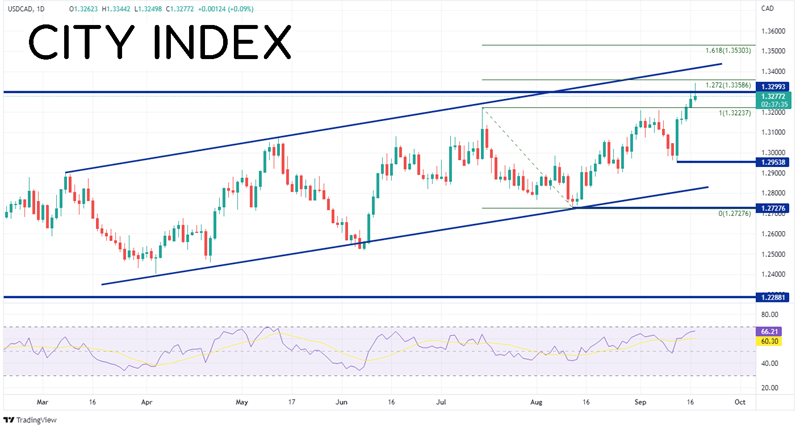
Source: Tradingview, Stone X
Trade USD/CAD now: Login or Open a new account!
• Open an account in the UK
• Open an account in Australia
• Open an account in Singapore
Will USD/CAD reverse and move lower? With significant resistance above, the chance of stronger than expected inflation data, and the possibility of a “less hawkish than expected” Fed, it Is possible. However, if the inflation data is weaker or the Fed is uber-hawkish, USD/CAD may continue its path higher. Shorts will most likely have tight stops above today's highs.
Learn more about forex trading opportunities.
Latest market news
Yesterday 01:32 PM
Yesterday 09:35 AM
Yesterday 07:23 AM
Yesterday 04:48 AM
Yesterday 12:17 AM
July 25, 2024 10:39 PM
Latest Trade Ideas articles

Yesterday 09:35 AM

Yesterday 12:17 AM

July 25, 2024 10:39 PM

July 25, 2024 05:30 PM