


February 14, 2023 8:06 PM

The NASDAQ 100 is trading at a key level. On the weekly timeframe, the NDQ pulled back to the 61.8% Fibonacci retracement level from the lows of March 2020 at 6771.91 to the all-time highs in November 2021 at 16764.86, near 10400.64. Notice the downward sloping trendline that the NASDAQ 100 remained under. From there, the index bounced to the 38.2% Fibonacci retracement level from the all-time high (see point 1) to the recent low in October 2022 between 16764.86 and 10400.64. In doing so, price broke above the previously mentioned trendline during the week of January 23, 2023. Price is currently consolidating at that 38.2% Fibonacci retracement level, near 12856.49.
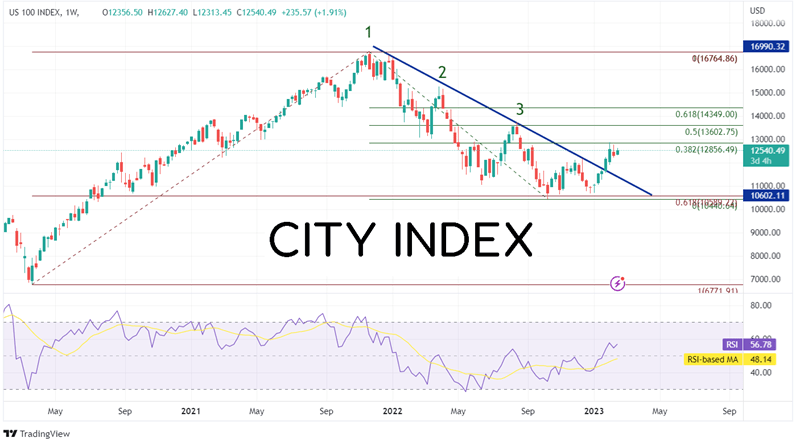
Source: Tradingview, Stone X
On a daily timeframe, the NASDAQ 100 has moved to 50% retracement level from the highs on March 29th, 2022 (see point 2) to the lows on October 13th, 2022, near 12853.03. In addition, price has moved above, not only the previously mentioned downward sloping trendline, but also above the 50-Day and the 200-Day Moving Averages. The large cap index appears to be consolidating in a flag pattern. If it breaks above the top trendline of the flag, the target is near 14463.57.
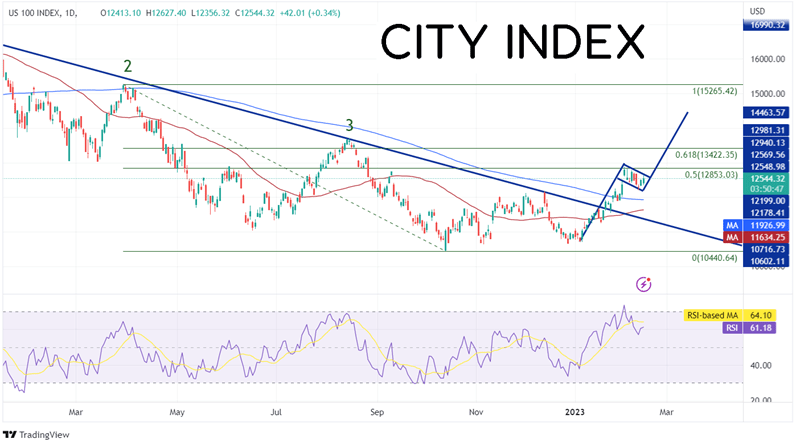
Source: Tradingview, Stone X
Trade the NASDAQ 100 now: Login or Open a new account!
• Open an account in the UK
• Open an account in Australia
• Open an account in Singapore
On a 240-miunute timeframe, the NASDAQ 100 has already broken above the 61.8% Fibonacci retracement level from the highs of August 16th, 2022 (see point 3) to the lows of October 2022, near 12467.85. Price has come back to this level in a consolidative pattern to form the flag. If price breaks higher, the target is the length of the flagpole, added to the breakout point, which in this case is near 14463.57. Notice that as price reached the peak of the flag, the RSI was in overbought territory. Upon the consolidation, the RSI was able to unwind back into neutral territory.
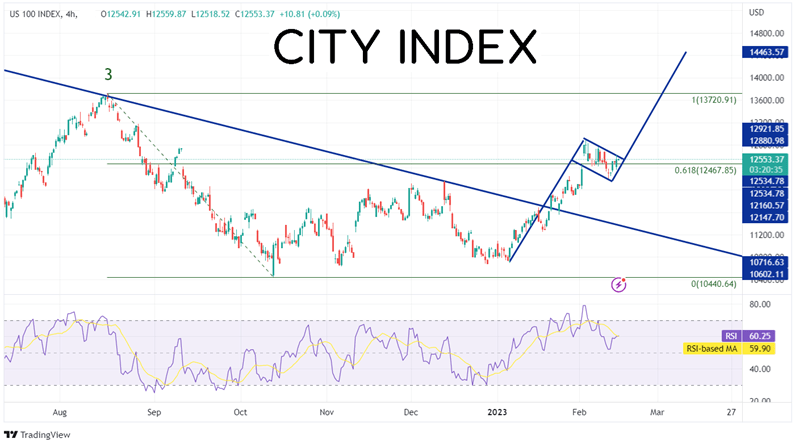
Source: Tradingview, Stone X
To summarize, after the NASDAQ 100 pulled back to the 61.8% Fibonacci level from the pandemic lows to the all-time highs, price bounced and is currently consolidating. The current level of 12,500 is near:
- The 38.2% Fibonacci retracement level from the all-time highs to the October 2022 lows on the weekly timeframe
- The 50% retracement level from the high of March 29th, 2022, to the low of October 2022 on the daily timeframe
- The 61.8% Fibonacci retracement level from the August 16th, 2022, highs to the low of October 2022 on the 240-minute timeframe.
In addition, the current consolidation is a bullish flag pattern with a target near 14462.57. If price does move higher, watch for resistance at 12853 (50% retracement on the daily and top of the flag), 13422 (the 61.8% Fibonacci retracement on the daily), 13602 (the 50% retracement on the weekly), and 14349 (the 61.8% Fibonacci retracement on the weekly). Support below is at the 200 Day Moving Average at 11927 and the 50 Day Moving Average at 11634, just ahead of the long-term trendline near 11345.
The NASDAQ 100 is currently trading at key levels. Price has formed a flag pattern, which is bullish for NDQ. If price can break above near-term levels, the NASDAQ 100 will have an easier time reaching its target.
Latest market news
Yesterday 01:32 PM
Yesterday 09:35 AM
Yesterday 07:23 AM
Yesterday 04:48 AM
Yesterday 12:17 AM
July 25, 2024 10:39 PM
Latest Trade Ideas articles

Yesterday 09:35 AM

Yesterday 12:17 AM

July 25, 2024 10:39 PM

July 25, 2024 05:30 PM