


Gold Takeaways
- Real yields are one of the most reliable fundamental drivers of gold prices historically.
- The 10-year real yield in the US is testing 2%, its highest level since the depths of the GFC in 2009.
- Gold is threatening to close lower for its 6th straight day, with potential to extend its drop toward $1865 before finding support.
Gold Fundamental Analysis
Supply, demand, central bank reserves, inflation expectations, investor risk appetite, lions, and tigers, and bears, oh my!
There are countless fundamental factors that traders cite as driving gold prices, but in my analysis, only one has been consistently reliable over the course of history: Real interest rates.
Real interest rates simply represent the opportunity cost of holding gold. When real interest rates are low, investment alternatives like cash and bonds tend to provide a low or negative return, pushing investors to seek alternative ways to protect the value of their wealth. On the other hand, when real interest rates are relatively high, strong returns are possible in cash and bonds, and the appeal of holding a yellow metal with few industrial uses diminishes. Beyond the opportunity cost of holding gold, interest rates also play a role in the cost of funds when buying gold on margin, as many traders do.
The chart below shows the current benchmark 10-year treasury bond yield minus market-derived estimate of the 10-year inflation, or essentially traders’ best guess of the “real,” after-inflation interest rate over the next 10 years:
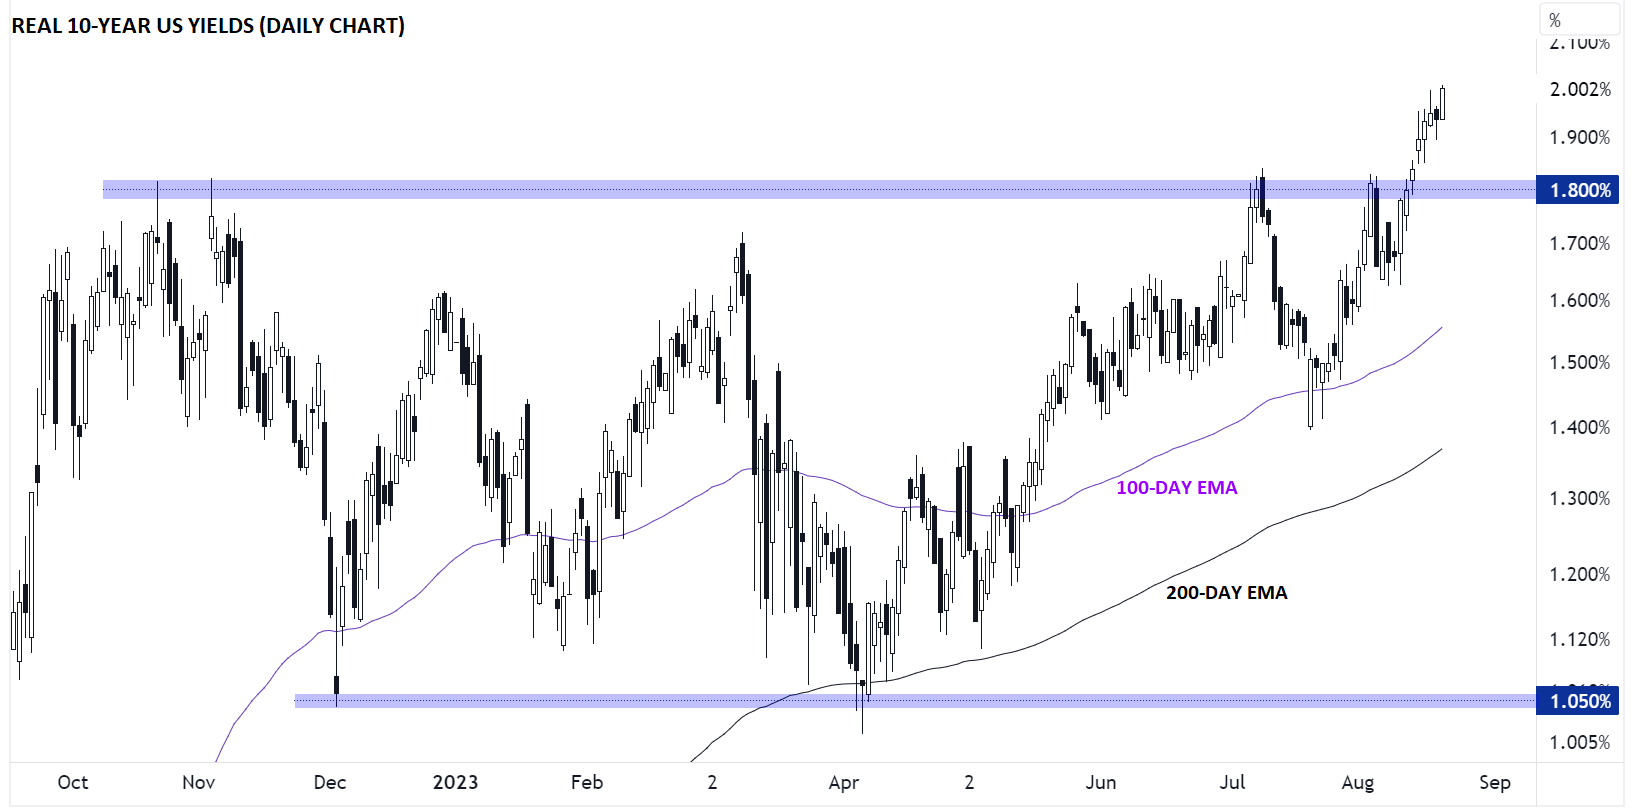
Source: TradingView, StoneX
As the chart shows, real interest rates in the United States have been marching consistently higher for four months, and at above 2%, real interest rates are at their highest level since the depths of the Great Financial Crisis in Q1 2009! The recent surge in real interest rates, creating a sudden proliferation of investments offering safe, after-inflation returns, is what’s driving the recent weakness in gold prices.
Gold Technical Analysis – Gold Daily Chart
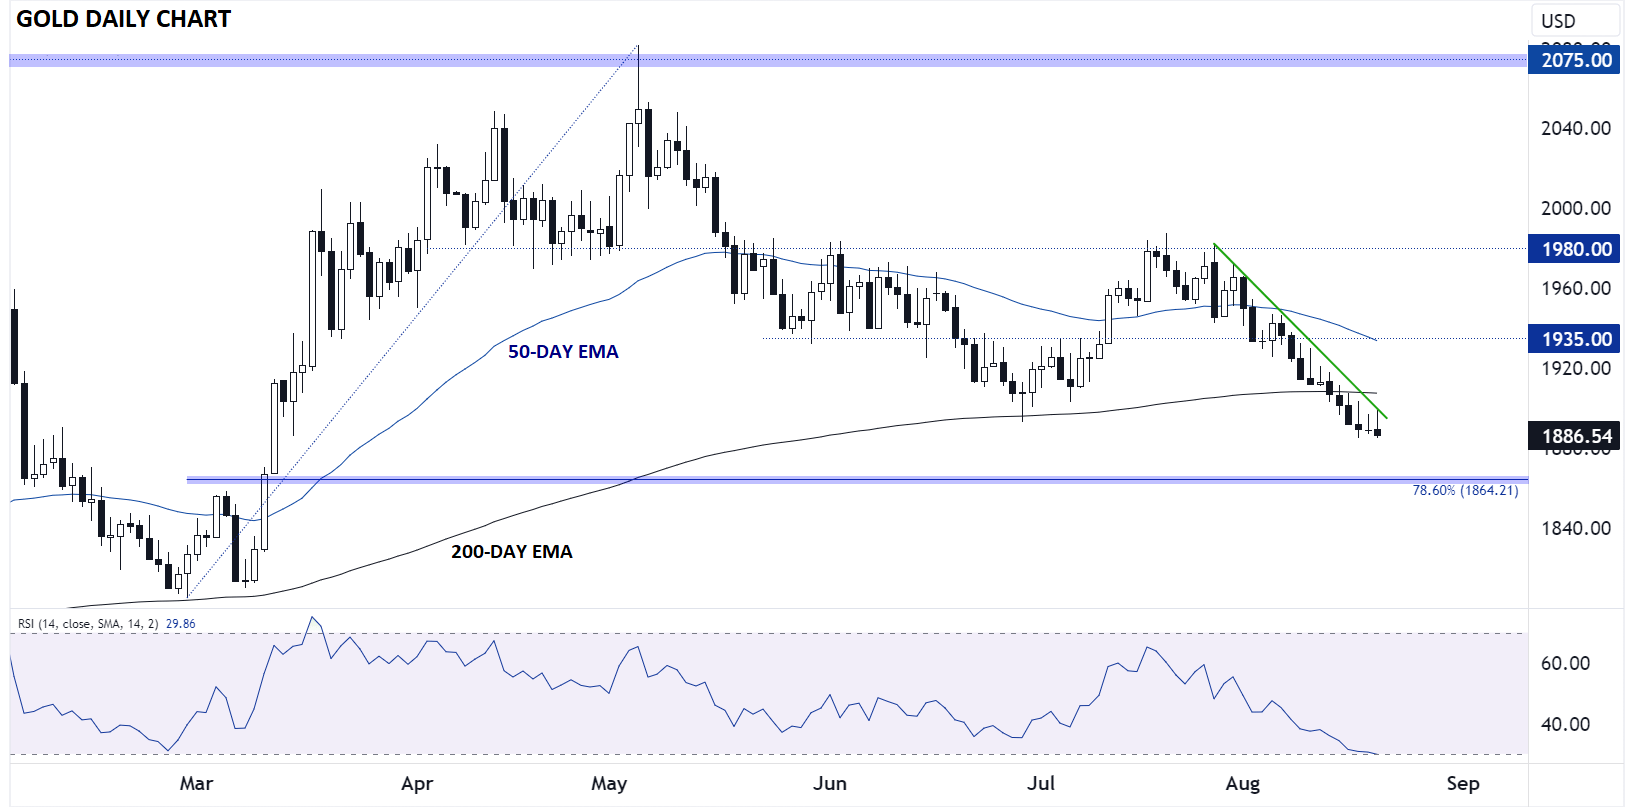
Source: TradingView, StoneX
Turning to the daily chart of gold itself, the yellow metal is threatening to fall for the 6th consecutive day and on track to close at its lowest level in more than five months. As long as real yields continue to grind higher, gold prices may remain under pressure, with little in the way of technical support until the 78.6% Fibonacci retracement of the March-May rally at $1865. Even an oversold bounce above the near-term bearish trend line could peter out quickly unless gold is able to recapture its 200-day EMA near $1907.
There’s little in the way of top-tier economic data this week, so gold traders will be well-served by keeping a chart of yields up on their secondary monitors.
-- Written by Matt Weller, Global Head of Research
Follow Matt on Twitter: @MWellerFX
Latest market news
Today 01:39 PM
Today 11:05 AM
Today 10:46 AM
Latest Gold articles

Today 11:05 AM


April 25, 2024 11:14 AM
April 23, 2024 11:30 AM