


Asian Indices:
- Australia's ASX 200 index rose by 44.4 points (0.62%) and currently trades at 7,205.70
- Japan's Nikkei 225 index has fallen by -461.26 points (-1.71%) and currently trades at 26,449.61
- Hong Kong's Hang Seng index has risen by 125.11 points (0.53%) and currently trades at 23,645.11
- China's A50 Index has risen by 29.61 points (0.2%) and currently trades at 14,865.00
UK and Europe:
- UK's FTSE 100 futures are currently up 21 points (0.28%), the cash market is currently estimated to open at 7,515.21
- Euro STOXX 50 futures are currently up 27 points (0.68%), the cash market is currently estimated to open at 4,012.47
- Germany's DAX futures are currently up 103 points (0.7%), the cash market is currently estimated to open at 14,796.00
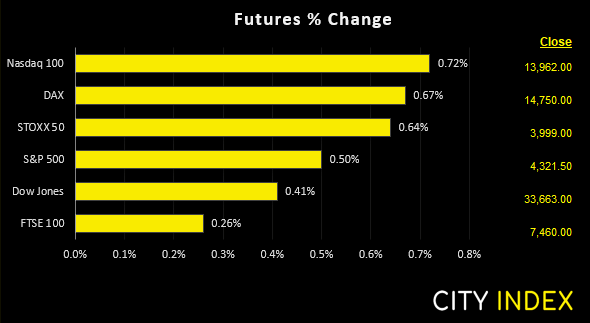
US Futures:
- DJI futures are currently up 141 points (0.42%)
- S&P 500 futures are currently up 100.25 points (0.72%)
- Nasdaq 100 futures are currently up 22.25 points (0.52%)
There was a clear change in sentiment overnight, as major benchmarks across Asia posted gains. China’s equities were the laggards and were off to a soft start, as state media took a swipe at rising property prices which weighed on the property sector. US and European futures are pointing towards a firmer open.
FTSE rises to a technical juncture
The FTSE made a strong comeback yesterday despite dropping around -120 points at the open. The strength of the rebound has left a long lower wick (buyers tail) at the low and it has closed back above a bullish trendline. This brings into question whether it can reach the lower target around 7300, near the base of the wedge.
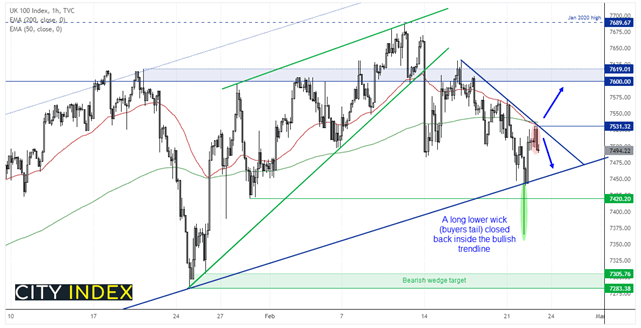
Ultimately, the FTSE finds itself at a technical juncture. A bearish 2-bar reversal has formed at the 50 and 200-bar eMA on the four-hour chart and trend resistance. As long as yesterday’s highs caps as resistance, a break below 7490 assumes another dip lower towards trend support. Should sentiment sour then we can revert to the bearish wedge target around 7300. But if prices break above 7540 it would clear the moving averages and trend resistance, and we would assume a bullish bias for the day.
FTSE 350: Market Internals
 FTSE 350: 4201.8 (0.13%) 22 February 2022
- 129 (36.86%) stocks advanced and 212 (60.57%) declined
- 3 stocks rose to a new 52-week high, 63 fell to new lows
- 28% of stocks closed above their 200-day average
- 26.29% of stocks closed above their 50-day average
- 13.71% of stocks closed above their 20-day average
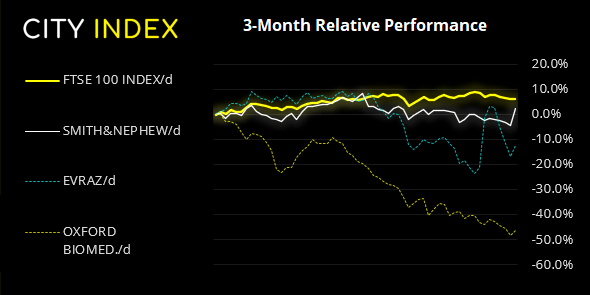
Outperformers:
- + 7.51% - Smith & Nephew PLC (SN.L)
- + 5.36% - EVRAZ plc (EVRE.L)
- + 4.58% - Oxford BioMedica PLC (OXB.L)
Underperformers:
- -16.22% - John Wood Group PLC (WG.L)
- -15.64% - Hargreaves Lansdown PLC (HRGV.L)
- -5.53% - Coca Cola HBC AG (CCH.L)
NZD strongest major after their 25 bps hawkish hike
RBNZ hiked 25 bps as expected, although minutes of the meeting revealed that it was a close call as to whether they would hike by 25 or 50 bps point at this meeting. At the press conference, Governor Orr said a 50 bps hike cannot be ruled out in the future. NZD was broadly higher against its major peers and took advantage of weaker safe havens CHF and JPY, with NZD/CHF rising to a 5-week high. AUD/NZD is below 1.0700 and our downside target remains around 1.0650, near the 50-day eMA.
EUR/AUD hit our bearish triangle target earlier in the Asian session. Whilst the hourly trend remains bearish we are mindful that it has fallen posted 11 bearish daily candles over the past 13 so happy to step aside from this one for now.
Gold back below 1900
With sentiment bruised yet showing signs of recovering, gold was a likely candidate to fall after its rally couldn’t quite probe the November high. After a minor effort to challenge 1900 earlier in the Asian session, momentum has now turned lower and looks ripe for the retracement to continue, unless tensions rise once more.
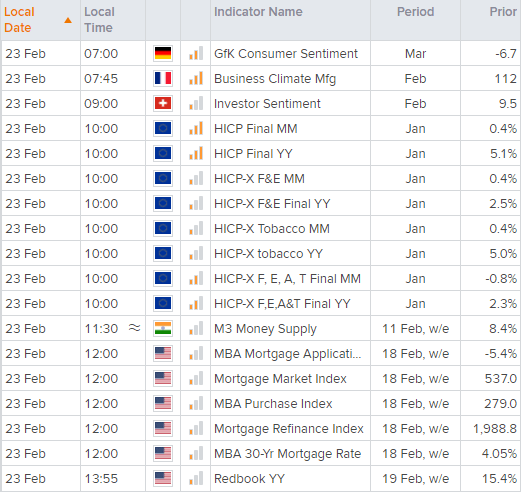
Up Next (Times in GMT)
How to trade with City Index
You can easily trade with City Index by using these four easy steps:
-
Open an account, or log in if you’re already a customer
• Open an account in the UK
• Open an account in Australia
• Open an account in Singapore
- Search for the company you want to trade in our award-winning platform
- Choose your position and size, and your stop and limit levels
- Place the trade
Latest market news
Yesterday 01:32 PM
Yesterday 09:35 AM
Yesterday 07:23 AM
Yesterday 04:48 AM
Yesterday 12:17 AM
July 25, 2024 10:39 PM
Latest Forex articles

Yesterday 12:17 AM

July 25, 2024 10:39 PM

July 25, 2024 03:59 PM

July 25, 2024 04:37 AM