


Asian Indices:
- Australia's ASX 200 index fell by -62.7 points (-0.86%) and currently trades at 7,225.80
- Japan's Nikkei 225 index has risen by 116.21 points (0.42%) and currently trades at 27,696.08
- Hong Kong's Hang Seng index has risen by 19.3 points (0.08%) and currently trades at 24,943.65
- China's A50 Index has risen by 138.33 points (0.91%) and currently trades at 15,269.86
UK and Europe:
- UK's FTSE 100 futures are currently down -71.5 points (-0.94%), the cash market is currently estimated to open at 7,600.90
- Euro STOXX 50 futures are currently down -55.5 points (-1.32%), the cash market is currently estimated to open at 4,141.57
- Germany's DAX futures are currently down -184 points (-1.19%), the cash market is currently estimated to open at 15,306.44
US Futures:
- DJI futures are currently down -219 points (-0.62%)
- S&P 500 futures are currently down -112 points (-0.76%)
- Nasdaq 100 futures are currently down -32.25 points (-0.72%)
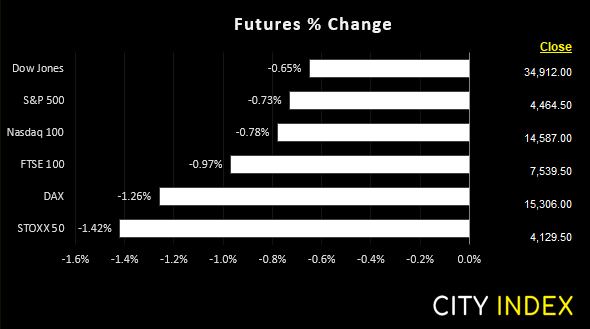
It appears the initial excitement over the prospects of an intermeeting hike form the Fed have resided. But we have since seen Goldman Sachs raise their target for the Fed to hike seven times this year, up from five before yesterday’s CPI print. Money markets are pricing in a 50 bps hike in March and this has helped keep the pressure on equities across parts of Asia with stocks in Japan and Australia currently down for the day. US and European futures have opened lower with the DAX and STOXX 50 off by around -1%.
FTSE 100 extended gains (but they could be ‘short lived)
The FTSE rose to within a cats-whisker of the January 2020 high yesterday. And we suspect that has marked the high for the week given FTSE futures are down around -0.8%. The RSI (2) sits at an overbought level of 95 so the stage appears set for some mean reversion. Whilst we do not yet know how severe any selling pressures may be, a key level for bulls to defend today is previous resistance at 7619.
FTSE 350: Market Internals
FTSE 350: 4324.64 (0.38%) 10 February 2022
- 182 (52.00%) stocks advanced and 153 (43.71%) declined
- 12 stocks rose to a new 52-week high, 4 fell to new lows
- 40% of stocks closed above their 200-day average
- 42.57% of stocks closed above their 50-day average
- 21.14% of stocks closed above their 20-day average
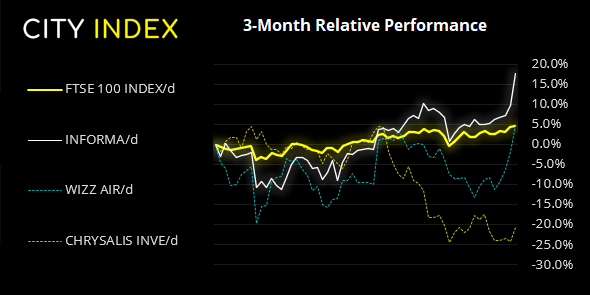
Outperformers:
- + 7.43% - Informa PLC (INF.L)
- + 6.50% - Wizz Air Holdings PLC (WIZZ.L)
- + 4.71% - Chrysalis Investments Ltd (CHRY.L)
Underperformers:
- -5.23% - Syncona Ltd (SYNCS.L)
- -4.86% - Trustpilot Group PLC (TRST.L)
- -3.00% - Renishaw PLC (RSW.L)
Gold’s rally falters
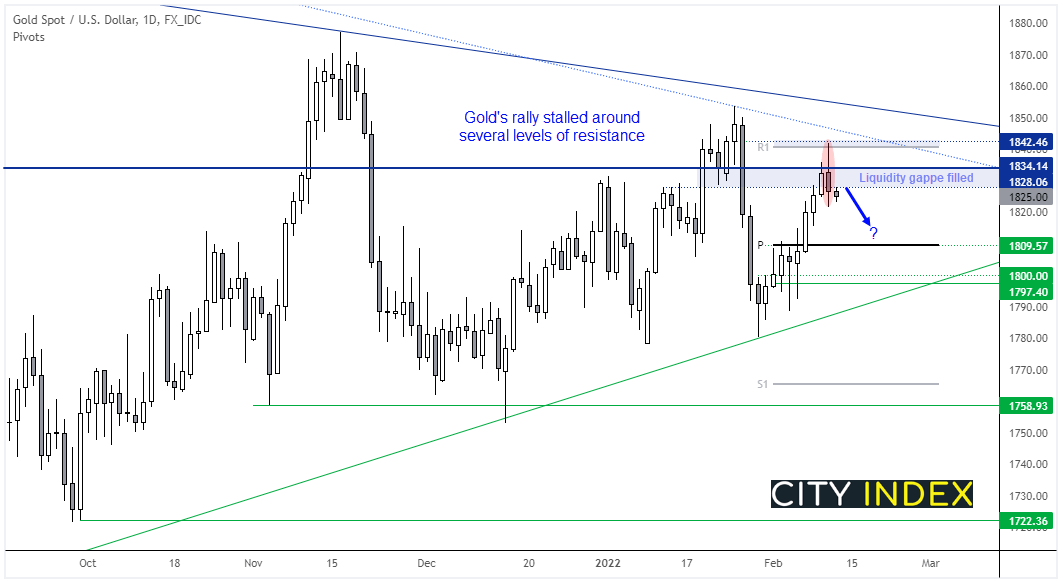
Volatile trade saw gold break a 4-day winning streak yesterday. The high of the day found resistance at the monthly R1 pivot, and the open price of the day ahead of its big selloff from around 1850. Most of the days trade also took place within an area we had highlighted as having liquidity gaps. Now those gaps have been filled with a down day, we think an interim top has formed on gold. For now, we prefer to fade into rallies below 1834 (previous resistance) with a break beneath 1820 assuming a run back down towards 1810, near the monthly pivot point.
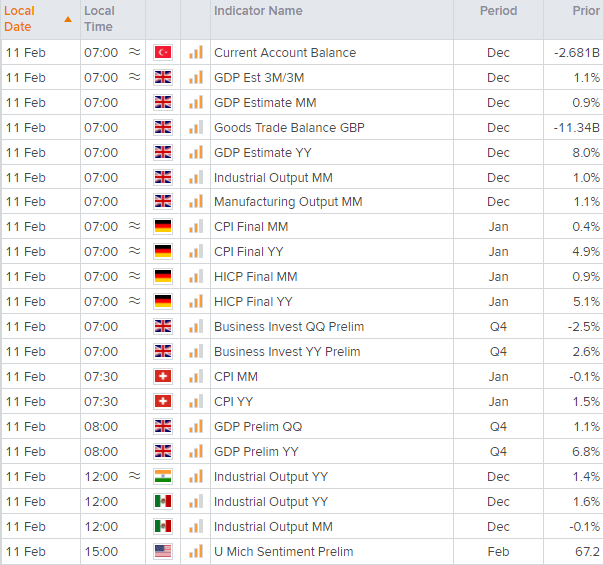
UK data dump at 07:00 GMT
GDP, industrial and manufacturing output are released shortly. Whilst it may not be a huge market mover given events yesterday, it could still benefit the pound against some currencies if the data comes in strong such as against the weaker Australian dollar.
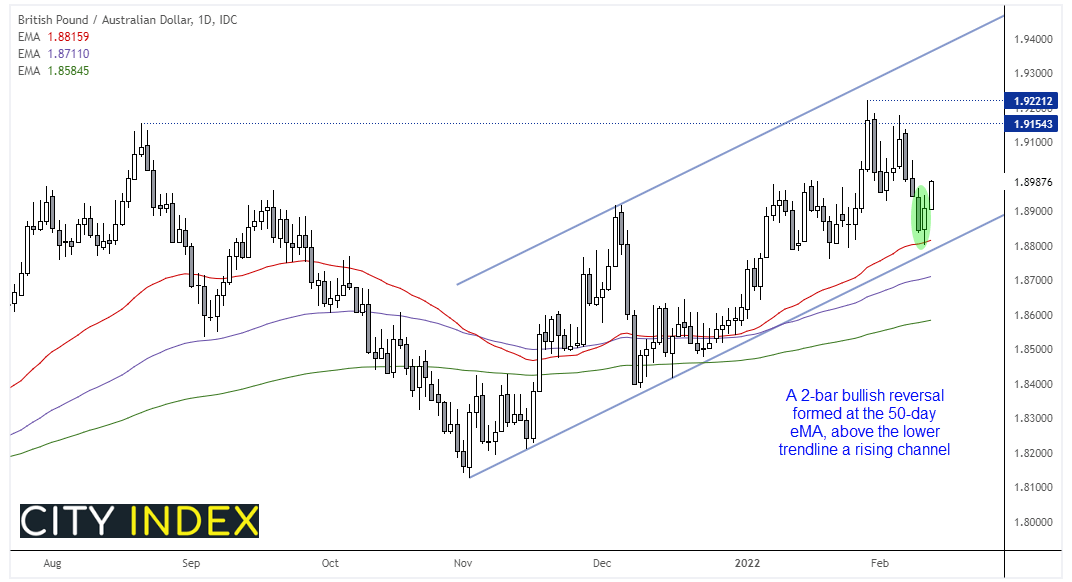
GBP/AUD found support at its 50-day eMA and formed a 2-bar bullish reversal pattern. The low also formed above the lower trendline of a rising channel. Prices have broken yesterday’s high overnight and we are now targeting the highs around 1.9150.
USD retains its strength
The US dollar remained the strongest currency, and so it should with calls for seven hikes this year. This places AUD and NZD as the weakest and, if we had to trade one of the two pairs short, we prefer the look of NZD/USD for potential short setups. It formed a bearish hammer on the daily chart at key resistance of 0.6700 and has since broken a rising trendline on the daily chart to confirm momentum has realigned with its bearish trend.
Up Next (Times in GMT)
How to trade with City Index
You can easily trade with City Index by using these four easy steps:
-
Open an account, or log in if you’re already a customer
• Open an account in the UK
• Open an account in Australia
• Open an account in Singapore
- Search for the company you want to trade in our award-winning platform
- Choose your position and size, and your stop and limit levels
- Place the trade
Latest market news
Yesterday 01:32 PM
Yesterday 09:35 AM
Yesterday 07:23 AM
Yesterday 04:48 AM
Yesterday 12:17 AM
July 25, 2024 10:39 PM
Latest Forex articles

Yesterday 12:17 AM

July 25, 2024 10:39 PM

July 25, 2024 03:59 PM

July 25, 2024 04:37 AM