


Asian Indices:
- Australia's ASX 200 index fell by -58.3 points (-0.83%) and currently trades at 6,980.30
- Japan's Nikkei 225 index has fallen by -294.04 points (-1.17%) and currently trades at 25,916.60
- Hong Kong's Hang Seng index has fallen by -121.71 points (-0.58%) and currently trades at 20,935.92
- China's A50 Index has fallen by -118.88 points (-0.85%) and currently trades at 13,785.39
UK and Europe:
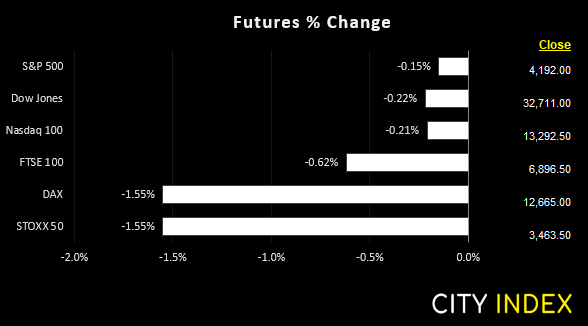
- UK's FTSE 100 futures are currently down -44 points (-0.63%), the cash market is currently estimated to open at 6,915.48
- Euro STOXX 50 futures are currently down -52.5 points (-1.49%), the cash market is currently estimated to open at 3,459.72
- Germany's DAX futures are currently down -183 points (-1.42%), the cash market is currently estimated to open at 12,651.65
US Futures:
- DJI futures are currently down -62 points (-0.19%)
- S&P 500 futures are currently down -25 points (-0.19%)
- Nasdaq 100 futures are currently down -5.75 points (-0.14%)
We do not feel confidence enough to say it will be a Turnaround Tuesday, but the lack of bearish follow-through should at least be noted. US futures trade around -0.1% lower, which is by no means setting off alarm bells. But as we have seen since Russia invaded Ukraine, headlines retain the ability to quickly flip sentiment and increase volatility at the tap of a keyboard.
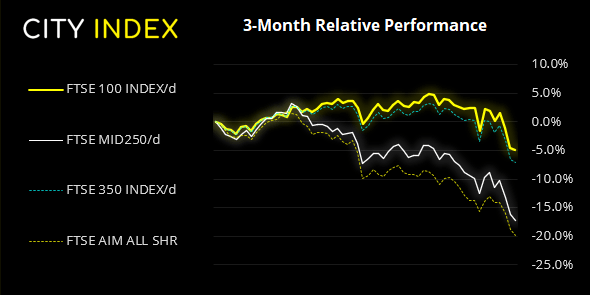
FTSE 350: Market Internals
FTSE 350: 3891.56 (-0.40%) 07 March 2022
- 105 (29.91%) stocks advanced and 243 (69.23%) declined
- 3 stocks rose to a new 52-week high, 158 fell to new lows
- 15.1% of stocks closed above their 200-day average
- 8.83% of stocks closed above their 50-day average
- 10.83% of stocks closed above their 20-day average
Outperformers:
- + 32.98% - Petropavlovsk PLC (POG.L)
- + 28.33% - EVRAZ plc (EVRE.L)
- + 8.05% - Shell PLC (SHEL.L)
Underperformers:
- -22.81% - Oxford Instruments PLC (OXIG.L)
- -9.94% - Hammerson PLC (HMSO.L)
- -8.30% - Baltic Classifieds Group PLC (BCG.L)
Oil holds the key to equity market direction
If we had to use one market to help gauge the reaction of others today, it would be oil. As it was the sharp rise in oil which triggered the sell-off in equities as traders priced in stagflation worries once again. Should oil prices stabilise then it should remove some selling pressure across equity markets. And should the West submit to the idea it will be a long and drawn-out process to wean themselves off-of Russian energy, oil prices could tail off and provide further support for equites. And makes Thursday’s meeting, where European leaders will discuss how to remove Russian energy, a pivotal (and volatile) event.
How to start oil tradingRussia ‘forecasts’ $300 oil
Russia have since threated to cut European gas supplies if Western allies ban their energy exports. We therefore expect Russia to be quite vocal on the subject leading up to the Versailles meeting. Russia’s claim that oil prices could reach $300 if their energy exports are banned seems far-fetched. It also sounds like a knee-jerk reaction to the West talking of an oil embargo, as Russia were perhaps not expecting it. And knee-jerk reactions can lead to other knee-jerk reactions, so headline risk will be a key driver for markets this week.
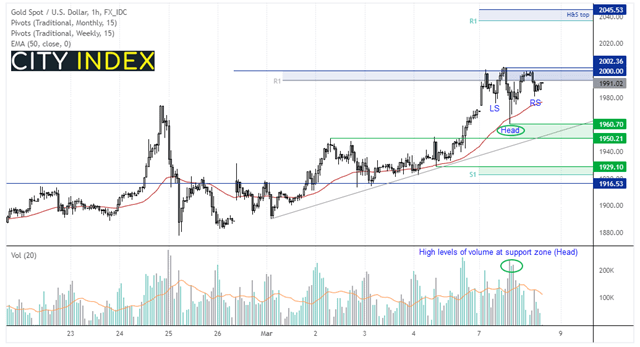
Gold remains bid, but $2k caps as resistance
Gold was the only metal to hold onto its market-open gains yesterday, whilst copper and palladium hit record highs before reversing lower. It’s no major surprise that gold met resistance at $2,000 as it is a psychological level, but the fact it closed just beneath it is a sign of strength. Sure, it has pulled back to $1985 but it has done so in an orderly way. It therefore remains bid and, without any good reasons to short at this level, it almost seems inevitable it will break higher this week.
How to start gold trading
The hourly chart remains in a strong uptrend and has found support at the 50-hour eMA. A potential inverted head and shoulders (H&S) would be confirmed with a break above 2003, which projects a target around 2045. Interim resistance levels would include 2020 and the weekly R1 pivot at 2038.
However, should momentum turn below the 1991 – 2003 resistance zone, it would remove the potential for the H&S but not necessarily remove our bias for an eventual breakout, as it could still be part of a corrective move. We would then look for a higher low to form above 1960 or along trend support.
GBP drifts higher overnight
The pound is the strongest major but the moves appear to be corrective in nature and not tied to any specific event. The Australian dollar is lower against the board as it (potentially overdue) retracement phase gets underway. A notable theme yesterday was that the US dollar regained its safe-haven bid, and also traded higher against the yen and Swiss franc. Although what likely helped soften the franc was a thinly veiled warnings from the SNB that their currency is too high and, therefore, they are likely to intervene to weaken it.
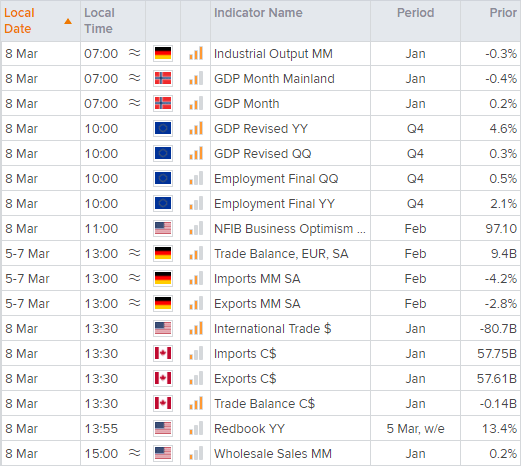
Up Next (Times in GMT)
How to trade with City Index
You can easily trade with City Index by using these four easy steps:
-
Open an account, or log in if you’re already a customer
• Open an account in the UK
• Open an account in Australia
• Open an account in Singapore
- Search for the company you want to trade in our award-winning platform
- Choose your position and size, and your stop and limit levels
- Place the trade
Latest market news
April 28, 2024 02:00 PM
Yesterday 03:00 PM
Yesterday 01:12 PM
Latest Forex articles
April 24, 2024 03:14 PM
April 24, 2024 11:00 AM
April 23, 2024 11:09 PM