


February 13, 2020 4:57 PM
EUR/GBP Testing 2019 Lows
EUR/USD has been down 8 of the last 9 trading days, and the 1 day it closed higher, it was only up 4 pips! Once the pair broke the neckline of the head and shoulders pattern last week, if was off to the races. Price has traded from 1.1094 down to today’s lows near 1.0834, which hasn’t been seen since May 2017.
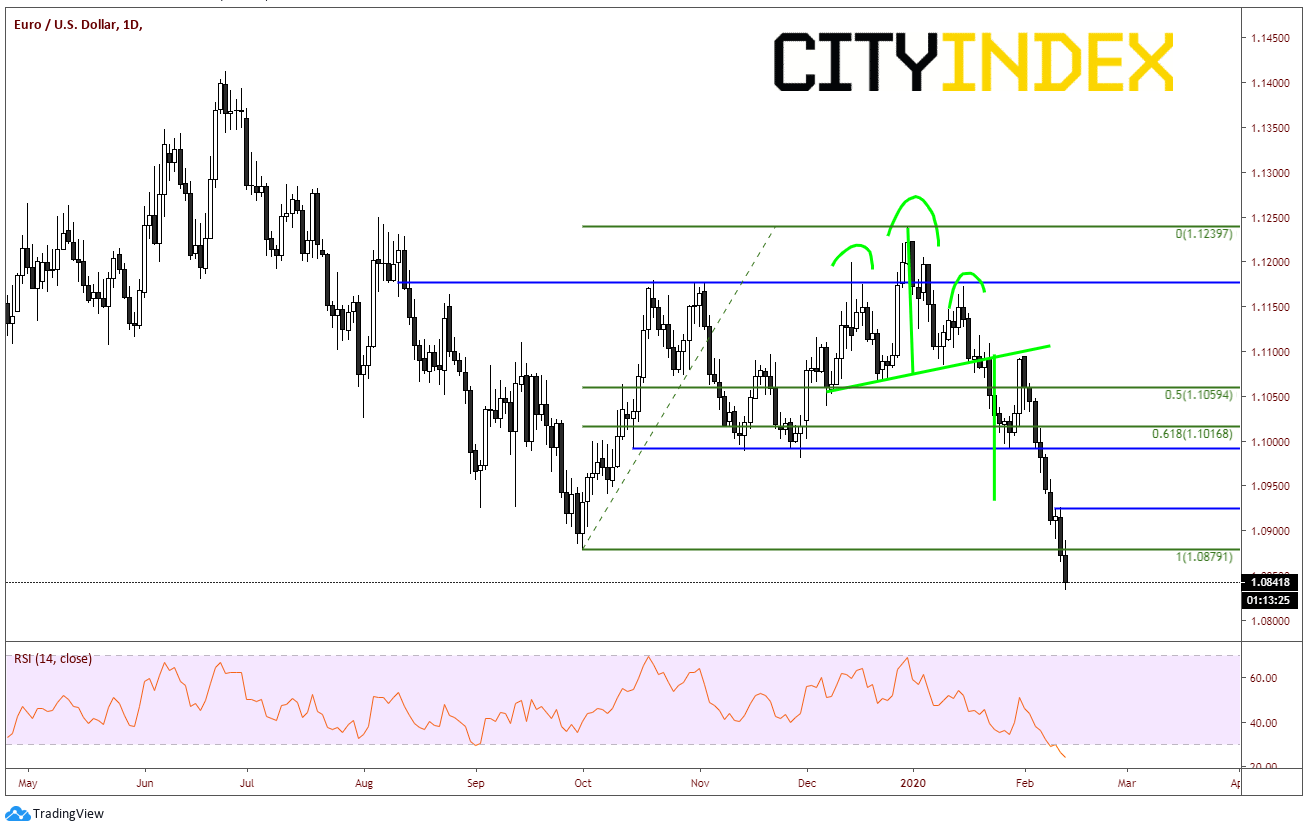
Source: Tradingview, City Index
Since election day on December 13th, 2019, GBP/USD has been trading in a symmetrical triangle. Price hadn’t done too much until last week when it tried to break lower from near the apex of the triangle, only to have that be a false breakdown and trade back into the apex today. Prime Minister Boris Johnson replaced Finance Minister Sajid David with Rishi Sunak, who traders believe will be more likely to induce more fiscal stimulus into the economy. This caused GBP/USD to go bid.
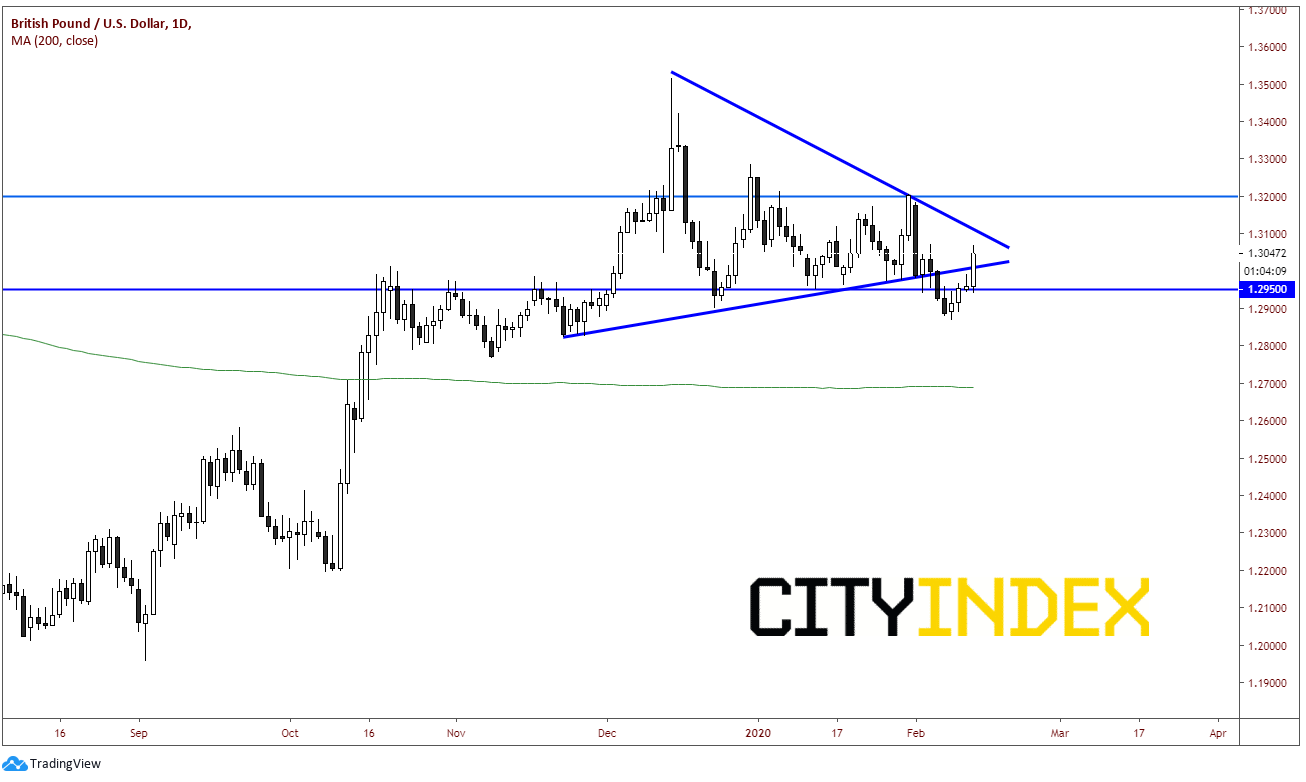
Source: Tradingview, City Index
With today’s price action in the Euro (lower) and Pound (higher), it seems logical that the next pair one would look at would be EUR/GBP, which is down almost 1% on the day. Technically, the pair has been trading nicely since August 2019, completing a flag pattern (blue) and almost reaching target (close enough for horseshoes) of a pennant pattern (orange). EUR/GBP reached a low of .8275 on UK election day, which was the low of the year for the pair. Price then bounced. However, with the Euro lower and the Pound stronger today, price is nearing the election lows once again. Price is currently trading near .8305. The first support for EUR/GBP is the .8275 level. Below that is the 127.2% Fibonacci extension level from the lows of May 8th, 2019 to the highs on August 12th, 2019 which is .8248. And although the previous mentioned pennant was almost reached, it once again is on our radar near .8165.
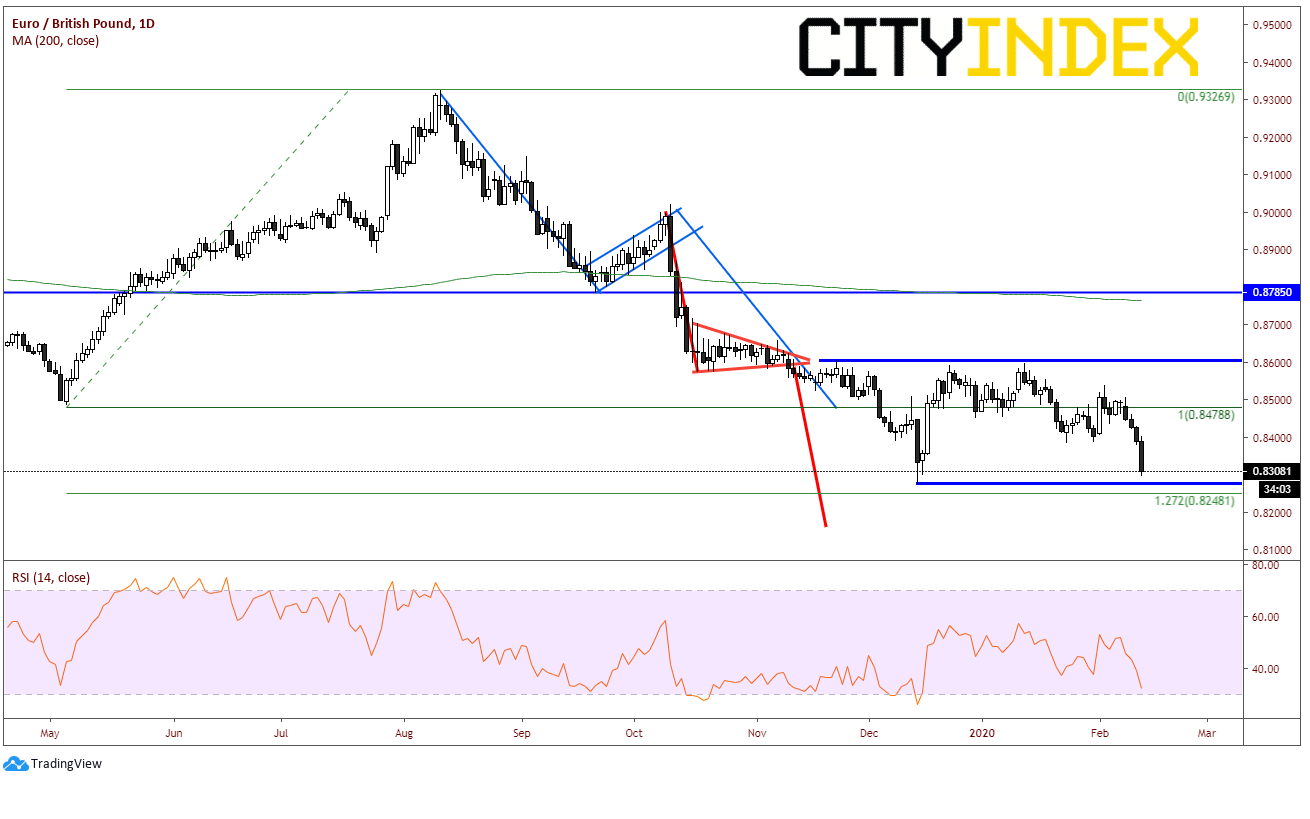 Source: Tradingview, City Index
Below that, we have to zoom out to a weekly chart as EUR/GBP would be trading at 2016 levels. There is horizontal support and the 50% retracement level from the July 2015 lows to the summer 2019 highs, near .8115. Although that level is 200 pips lower, if price does reach it, there are likely to be strong buyers with ahead of that level with stops building below it.
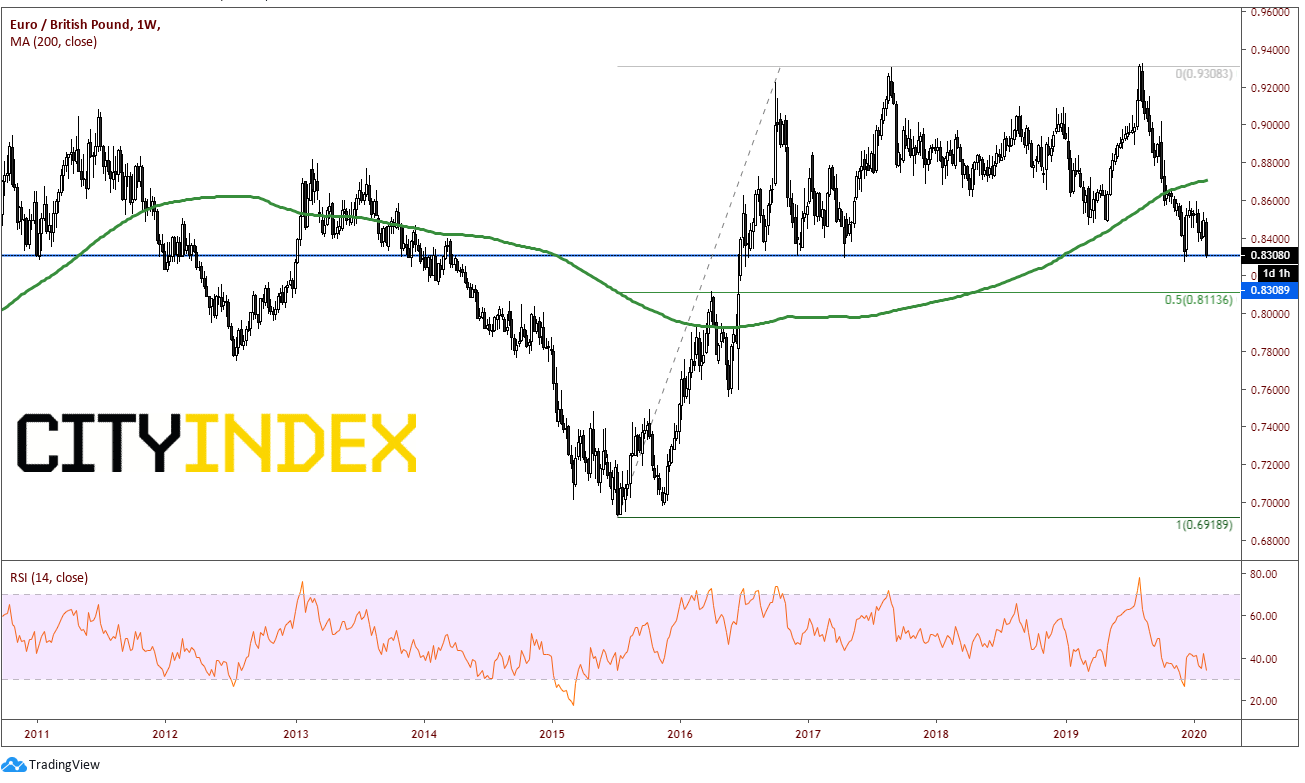
Source: Tradingview, City Index
First resistance isn’t until near .8390, however notice on the 240-minute chart how the RSI in below 20, in extremely oversold territory. Price may bounce for the RSI to unwind. Above there, the next level of resistance is near .8435. The ultimate resistance though isn’t until the 2020 highs near .8595.
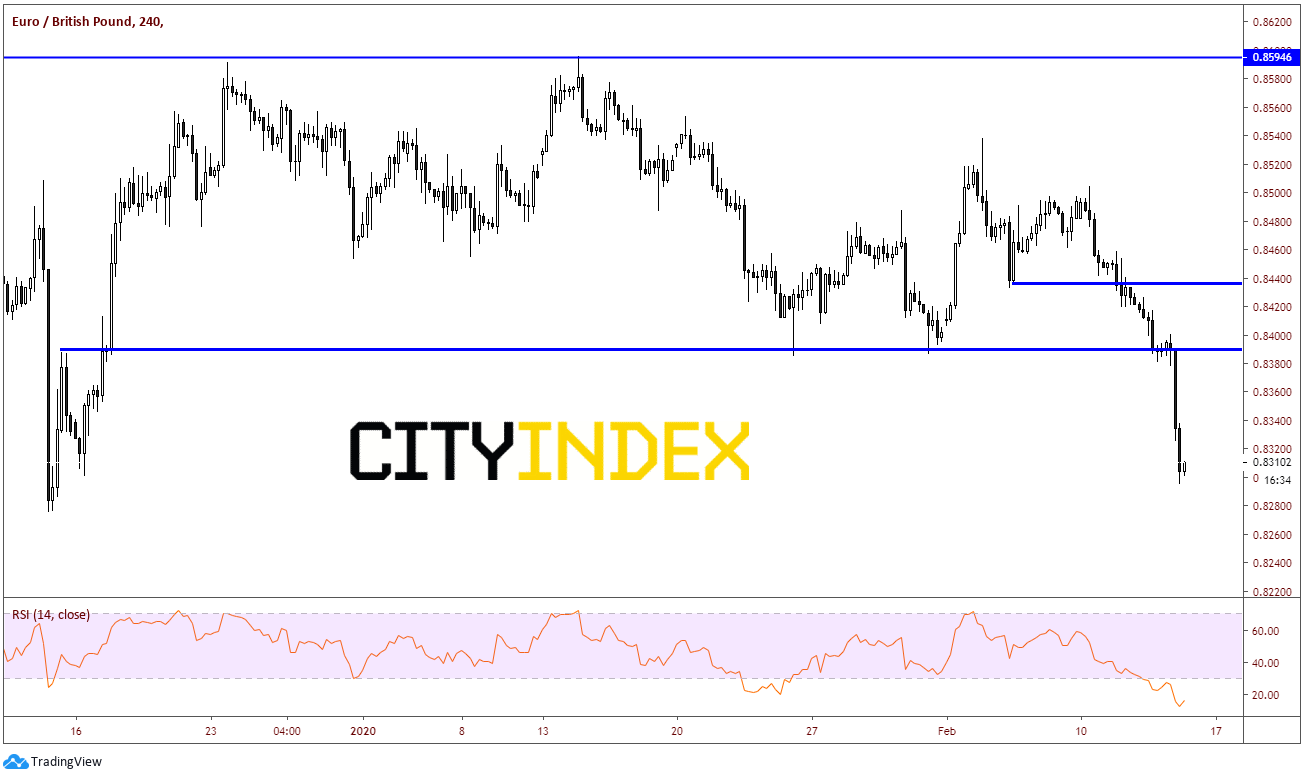
Source: Tradingview, City Index
Although EUR/GBP appears to be heading lower, the short-term RSI allows for the opportunity to bounce first. However, given that EUR/USD has closed near the lows of the day today (again), we can expect sellers to be looking for any bounce to take advantage and push price lower.
Latest market news
Yesterday 01:32 PM
Yesterday 09:35 AM
Yesterday 07:23 AM
Yesterday 04:48 AM
Yesterday 12:17 AM
July 25, 2024 10:39 PM
Latest Dollar articles
April 23, 2024 11:09 PM
April 18, 2024 06:20 AM

February 16, 2024 11:30 AM

February 7, 2024 03:30 PM