


EUR/GBP falls after UK GDP & ahead of EZ CPI
- UK Q4 GDP rises to 0.1%
- Eurozone CPI to cool to 7.1% but core CPI to rise
- EUR/GBP break out trade
EUR/GBP is falling for a second session as investors digest stronger than expected UK GDP data, weaker German retail sales and look ahead to eurozone inflation.
The UK economy grew at a faster pace than expected in the final three months of 2022. The Q4 GDP was upwardly revised to 0.1% up from 0% showing that the UK avoided a technical recession and saw a stronger end to 2022 than expected.
Slightly stronger growth, coupled with a rise in inflation keeps the pressure on the BoE to hike rates further.
Meanwhile German retail sales unexpectedly fell -1.3% MoM in February, after falling -0.3% in January and defying expectations of a 0.5% rise.
Looking ahead, Eurozone inflation is also expected to fall to 7.1% from 8.3%. However, core inflation, which strips out more volatile items such as food and fuel is actually expected to rise to 5.7% up from 5.6% in February. Sticky inflation keeps pressure on the ECB to keep raising interest rates.
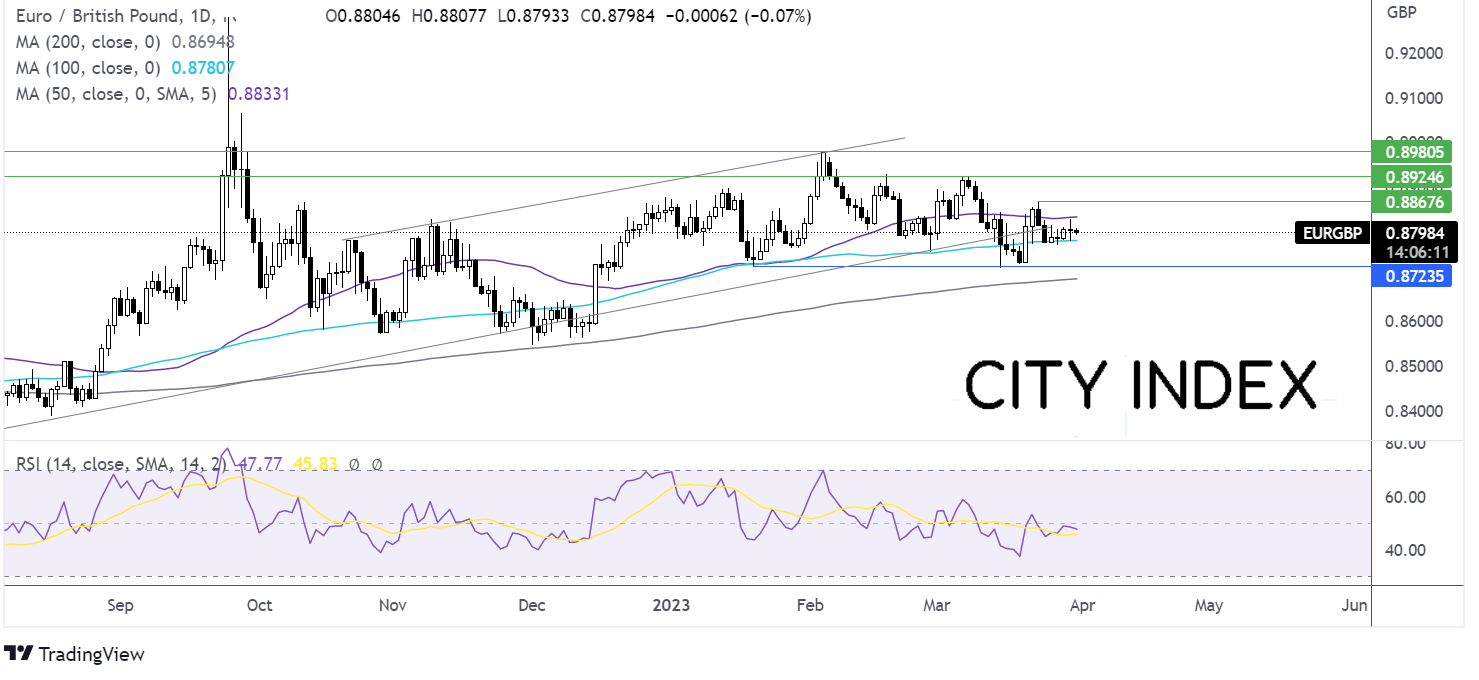
Where next for EUR/GBP?
EUR/GBP trades caught between the mildly upward sloping 50 and 100 sma. The RSI is neutral and yesterday’s doji candle highlights the pairs indecision ahead of eurozone inflation data.
A breakout trade could be in play. Buyers may look for a rise above the 50 sma at 0.8830, the weekly high, to extend gains towards 0.8865, last weeks high. A rise above here brings 0.8925 the March high into play.
Sellers could look for a fall below 0.8780 the 100 sma and the weekly low. A break below here opens the door to 0.8720 the March low.
Gold rises ahead of US core PCE bringing $2000 into focus
- Gold set to rise 8.7% this month
- Core PCE to hold at 4.7%
- Gold rises towards resistance at 1992
Gold is rising for a second straight day and is on track for a weekly gain as investors look ahead to the release of US core PCE data, the Federal Reserve’s preferred measure for inflation.
The precious metal has jumped 8.7% so far this month after the banking sector turmoil which drove safe haven trade and saw investors scale back rate hike bets and even price in 2 rate cuts by the end of the year.
US core PCE is forecast to hold steady at 4.7%YoY in February, and rise at a slower pace of 0.4%MoM down from 0.6%. Meanwhile personal spending is expected to slow to 0.3% after surging to 1.8% in January. Hot inflation and high spending could fuel Fed rate hike bets and drag gold lower.
Meanwhile cooler than expected data could help drive the precious metal higher as fewer rate hikes benefit non-yielding gold.
Ahead of today’s core PCE data the market is pricing in a 55% probability of a 25 basis point rate hike in May.
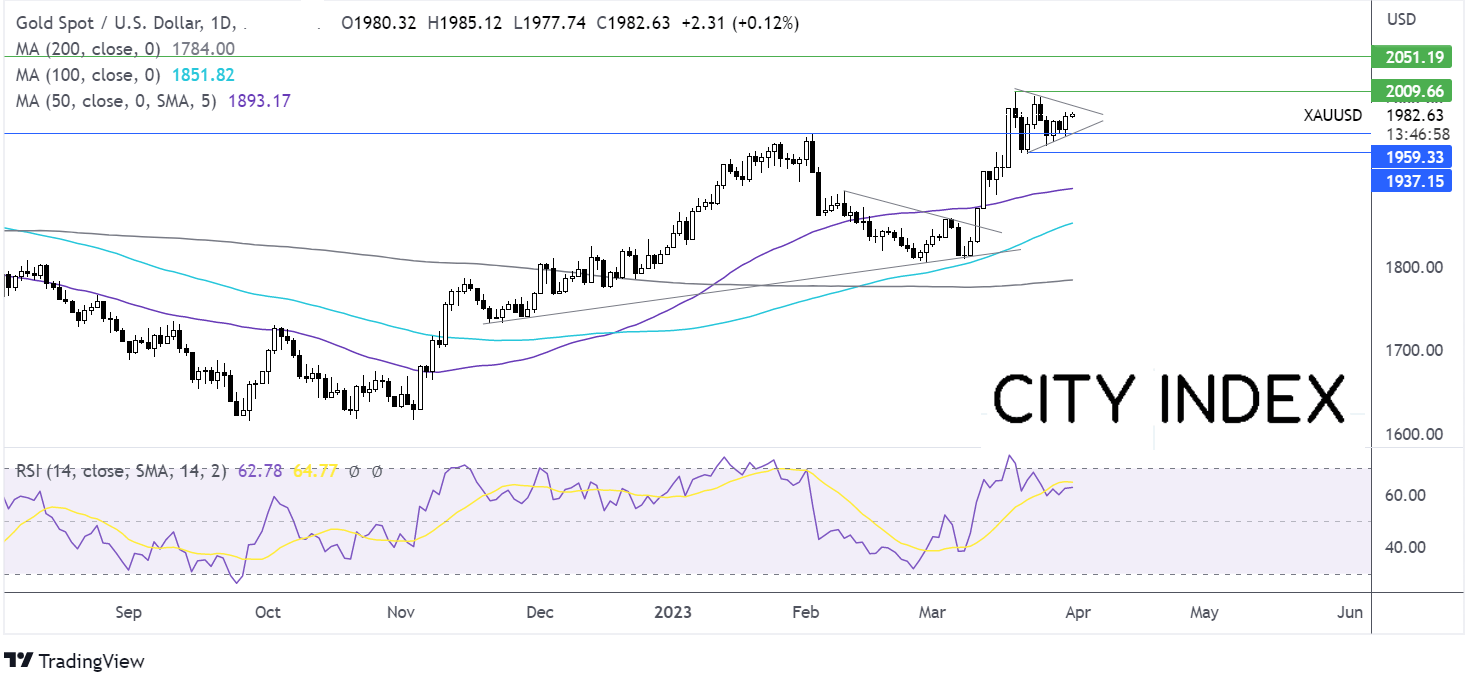
Where next for Gold prices?
Gold rebounded from 1955 low the rising trendline support and is extending those gains. The RSI is above 50, suggesting that momentum remains and keeps buyers hopeful of further upside.
Buyers could look for a rise above the falling trendline at 1992, to bring 2000 the psychological level into focus. A rise above here opens the door to 2010 the 2023 high.
Failure to retake 1992 could see sellers push the price back to test support at 1960 the rising trendline support and the February high. Below here 1935 comes into play the March 22 low.
Latest market news
Yesterday 01:32 PM
Yesterday 09:35 AM
Yesterday 07:23 AM
Yesterday 04:48 AM
Yesterday 12:17 AM
July 25, 2024 10:39 PM
Latest Trade Ideas articles

Yesterday 09:35 AM

Yesterday 12:17 AM

July 25, 2024 10:39 PM

July 25, 2024 05:30 PM