


Most of the action was seen on the New Zealand dollar during Wednesday’s Asian session with a hotter-than expected CPI report. Still, whilst inflation increased to 0.6% q/q from 0.5%, it was a lot better than the 6.8% q/q figure reported by some outlets. Needless to say, this triggered quite a bullish reaction from NZD pairs, although they held onto much of the gains as 0.6% quarterly inflation and 4% annual is too hot for the RBNZ to begin signalling a dovish pivot.
- Needless to say, NZD/USD was the strongest FX major which also heled AUD/USD track it higher given the close connection between the two economies (but AUD/USD had also found support at the 64c level).
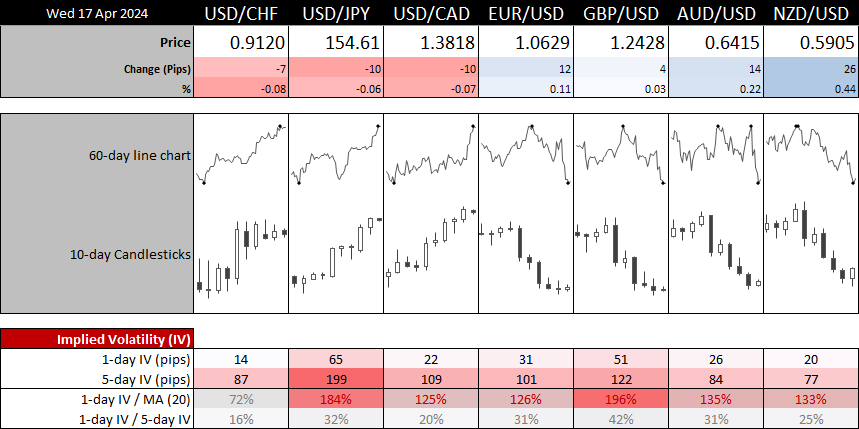
- Implied volatility has spiked higher got GBP/USD ahead of today’s UK inflation report, with the 1-day IV range nearly 200% of its 20-day average
- Take note that UK inflation data is released at 07:00 GMT+1
- 1-day IV is 184% of its 20-day MA, with concerns of headline risks for the Middle East likely playing on traders minds amid a stock-market pullback
- This has also seen implied volatility levels slightly elevated for AUD/USD, EUR/USD and USD/CAD
- EUR/USD trades slightly higher in the Asian session after Tuesday’s bearish day held above 1.06
- Also note that bearish volatility for EUR/USD has been considerably lower for EUR/USD these past two days, which to me suggests we could be nearing a pullback on EUR/USD
EUR/USD technical analysis (weekly chart):
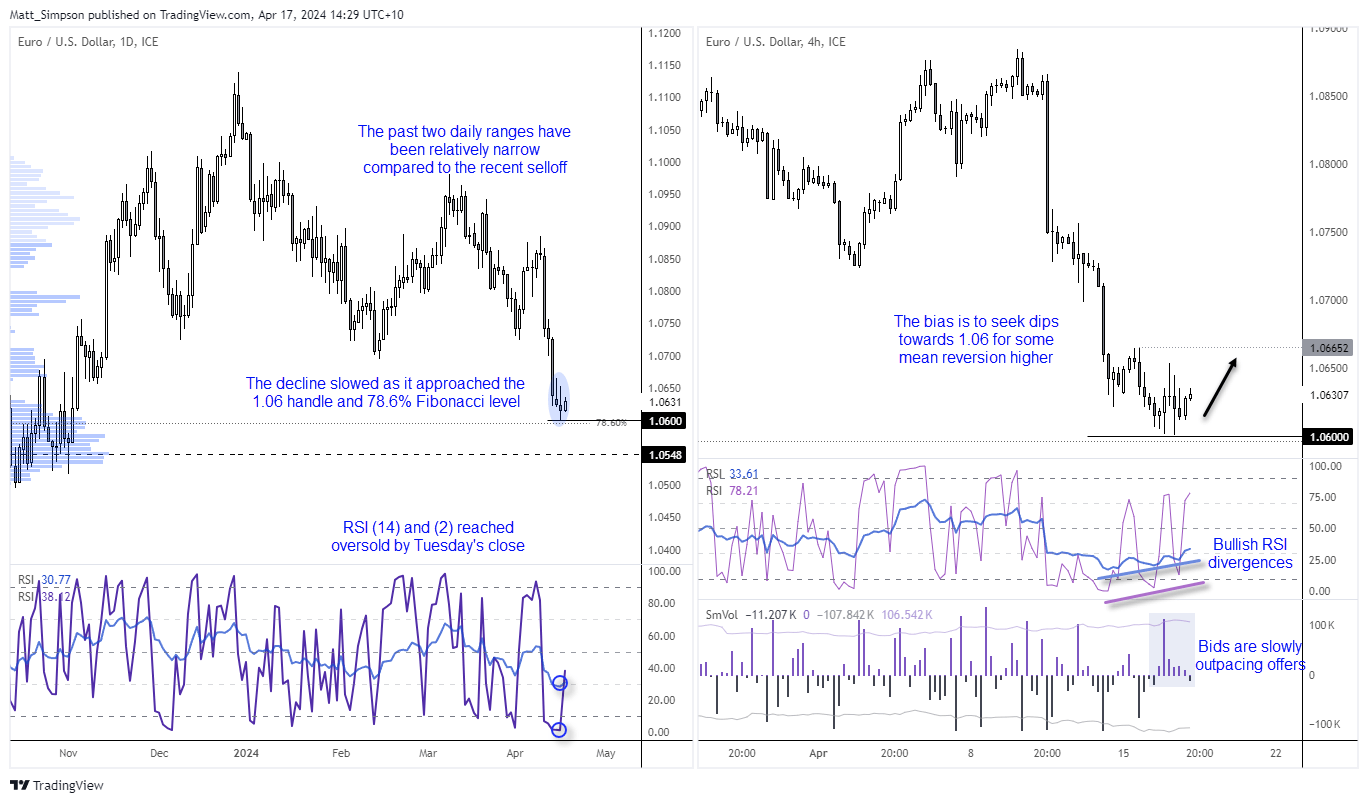
The EUR/USD has buckled under the pressure of a strong US dollar and prospects of an ECB cut in June. Yet it may be in need of some mean reversion. The past two days trade has seen relatively low daily ranges, which shows bearish momentum waning as it approached the 1.06 handle and 78.6% Fibonacci level. RSI (14) and (2) also reached oversold levels by Tuesday’s close to suggest the downside move was becoming overextended.
The 4-hour chart shows that bullish divergences are forming on both RSIs, and that bids (buyers) are slowly outnumbering offers (sells) with the positive delta volume on the lower indicator panel.
Therefore, today’s bias is to seek dips towards 1.06 in anticipation of some mean reversion towards 1.065 at a minimum – a break above 1.0665 assumes a deeper correction higher.
DAX technical analysis (weekly chart):
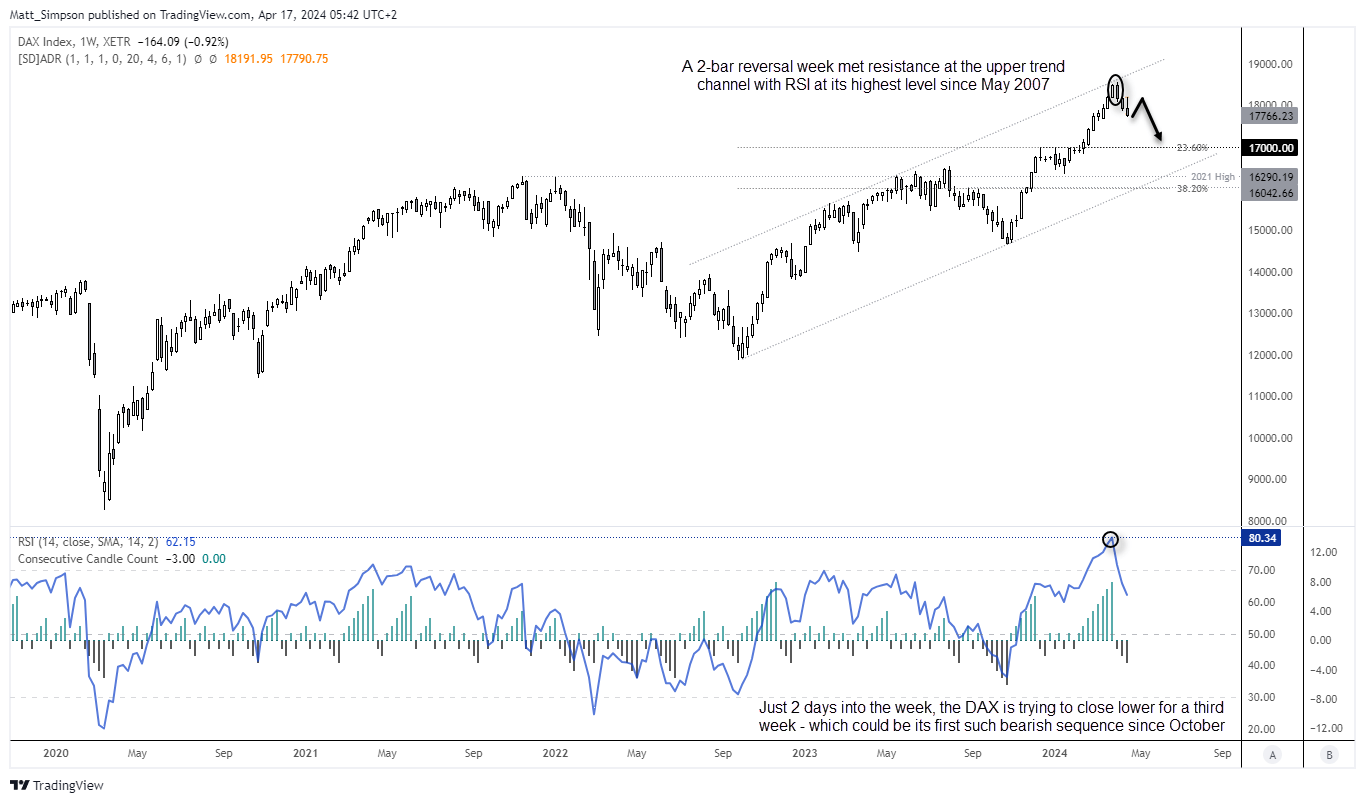
The record to a new high saw the DAX failed to hold above 18,400 at the beginning of April, after meeting resistance at the upper trend channel. The weekly RSI (14) was at its most bullish level since May 2007, so perhaps the rally was pushing its luck. But with no signs of a bearish divergence on the weekly RSI, an eventual break to new highs cannot be ruled out.
Still, the depth of the channel allows for a relatively deep retracement within it before breaking its bulls structure, and even a pullback to 17,000 (near a 23.6% Fibonacci level) would see the channel remain intact. So I’ll refer to the daily and intraday charts to help identify potential levels of support, in anticipation of swing lows.
Besides, just two days into the week, the DAX it is trying to close lower for a third consecutive week – which would be its first such bearish sequence since October, if it does.
DAX technical analysis (daily chart):
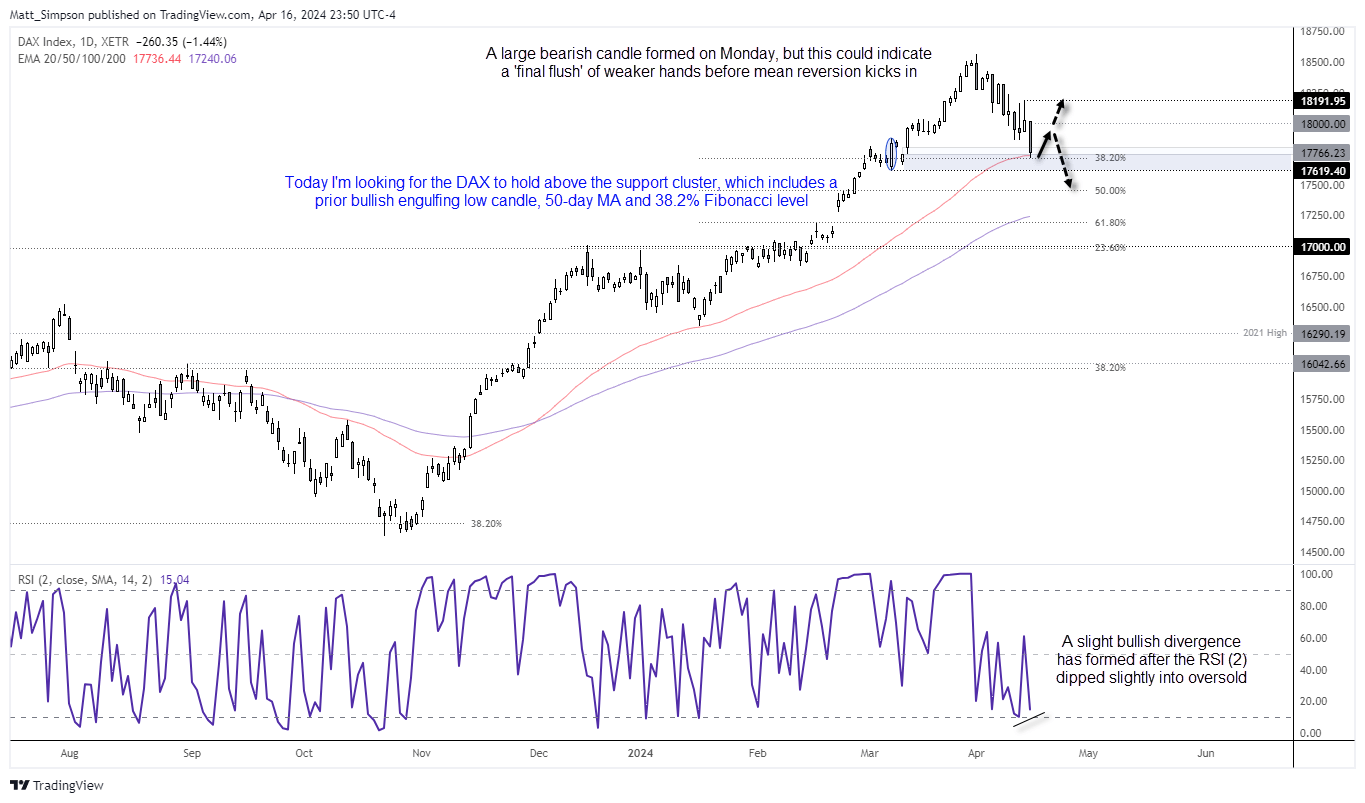
Momentum is clearly pointing lower on the DAX daily chart. Yet it found support at the 50-day EMA and 38.2% Fibonacci level. RSI (2) also formed a slight bullish divergence after dipping into oversold, so perhaps a swing low is near. As ling as prices remain above the highlighted bullish engulfing candle, the bias is for a bounce towards 18k.
To expect it to rally further likely requires a serious improvement for risk appetite, which can be reassessed if we get near that level. For today, bears can either wait for break low or seek evidence of another swing high for shorts. Personally, my preference is for a bounce and for longs up to 18k.
DAX futures technical analysis (d-hour chart):
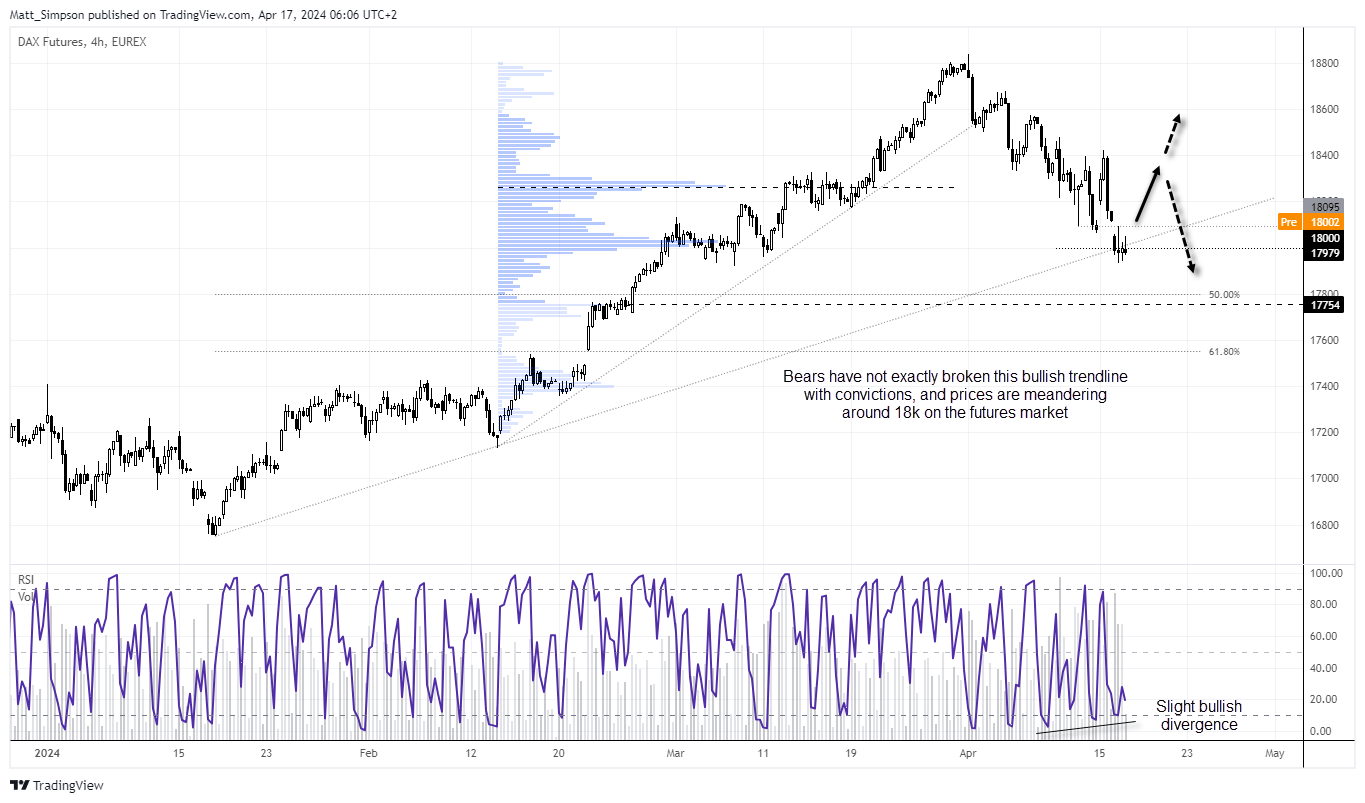
To fine-tune the analysis I’ll look at DAX futures, as it is grappling with its own support levels. There is certainly some noise around 18k, and whilst it has traded beneath the bullish trendline it has not exactly annihilated with any confidence. Therefore, a positive development for the bullish bias is to see momentum turn higher from current levels (or even after an obligatory ‘false move’ after the European open).
Bulls could wait for futures to break above the 18,046 4-hour candle before considering longs – or for extra confirmation, wait for a break above 81,000.
View the full economic calendar
-- Written by Matt Simpson
Follow Matt on Twitter @cLeverEdge
How to trade with City Index
You can trade with City Index by following these four easy steps:
-
Open an account, or log in if you’re already a customer
• Open an account in the UK
• Open an account in Australia
• Open an account in Singapore
- Search for the market you want to trade in our award-winning platform
- Choose your position and size, and your stop and limit levels
- Place the trade
Latest market news
Yesterday 01:32 PM
Yesterday 09:35 AM
Yesterday 07:23 AM
Yesterday 04:48 AM
Yesterday 12:17 AM
July 25, 2024 10:39 PM
Latest Trade Ideas articles

Yesterday 09:35 AM

Yesterday 12:17 AM

July 25, 2024 10:39 PM

July 25, 2024 05:30 PM