


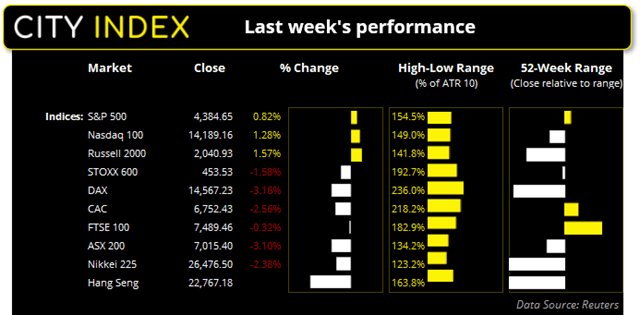
There was really only one main driver for markets last week, and that was very much Russia’s invasion of Ukraine. Equity index markets spent the first half of the week heading lower as Russia ramped up their troops around Ukraine’s border. Yet when the invasion officially took place on Thursday markets still behaved like it came as a surprise. Sanctions from the west were deemed as too little too late and did little to stop the sell-off. Yet by Friday the US and Europe began hitting Russia and in particular Putin much harder, which resulted in a short-covering rally ahead of the weekend. By the end of the week, it was Asian markets which fared the worst with the Hang Seng down over -6.4% and the ASX 200 -3.1% lower. Although these markets missed out on Friday’s rebound in the US due to being closed.
Sanctions are now hitting Putin where it hurts
News that Russia has been removed select banks from the SWIFT payment system, the EU has barred any transactions with Russia’s central bank and sanctions have been placed directly on Putin himself have more than irked the aggressor. And the fact that the invasion has not resulted in a quick victory for Russia as Ukraine put up a good fight (with many Russian troops being killed along the way) simply adds insult to injury.
Nuclear war, whilst unlikely, is not impossible
Yet we now question whether sanctions are too strong and whether they could provoke Putin enough to ‘go nuclear’. Whilst this remains an outside chance it is far from impossible, and therefore something that should be taken seriously. Ukraine’s Russian-friendly neighbour, Belarus, voted in favour of removing their no-nuclear status on the weekend and the President has vowed to ask Russia for nuclear weapons should NATO move their own nuclear weapons to Poland.
S&P 500 closed back above its 50-week eMA
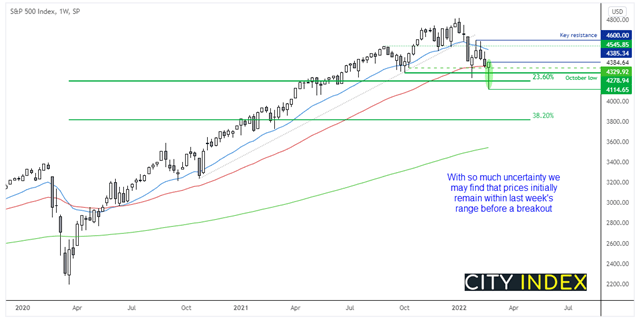
At its lowest point last week Wednesday the S&P 500 had fallen -5.4% from the previous week’s close. That it managed to close the week 0.8% higher is an impressive turnaround, as markets responded with tougher sanctions on Russia. This means that the index has printed a bullish pinbar on the weekly chart which is confirmed with a break of its high at 4385.34. But as futures markets opened lower today we do not expect an immediate bullish breakout. We may also find that price action remains choppy and confined within last week’s range until we either see an end to the war (which is likely to be bullish for markets) or tensions escalates further (if the war extends beyond Ukraine’s borders.
The DAX breaks out of a multi-month bearish reversal pattern
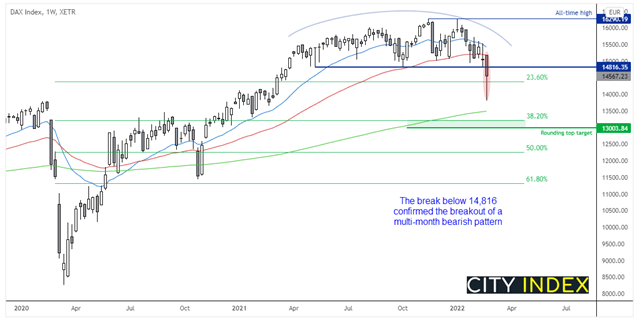
Volatility did not escape European markets last week either. We had wondered if support just below 15,000 would hold a lot longer than it did, but the break below 14,816 confirmed a multi-month bearish reversal pattern called a rounding top. The pattern projects a target just above 13k, and our bias remains bearish below the 14,816.35 resistance level.
Japanese yen futures positioning:
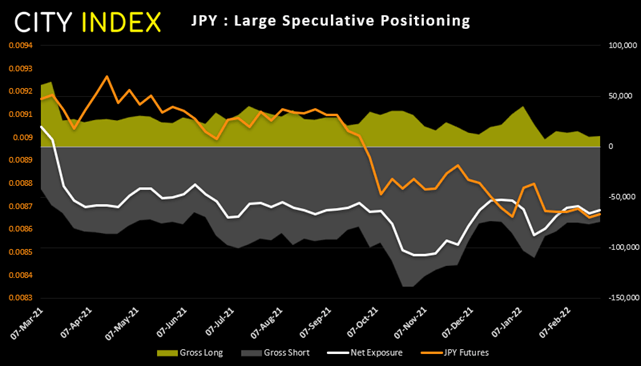
Traders have been net-short the Japanese yen since March 2021, although bearish net-exposure has been trimmed over five of the last six weeks. As this report is only accurate up to Tuesday 2nd February it does not capture safe-haven inflows due to Russia’s invasion. We therefore suspect bearish positing have been trimmed further. But it should also be noted that we’re not seeing an increase of bullish bets, which is a key ingredient for any sustainable rally to the yen’s advantage.
Nikkei futures positioning (priced in yen):
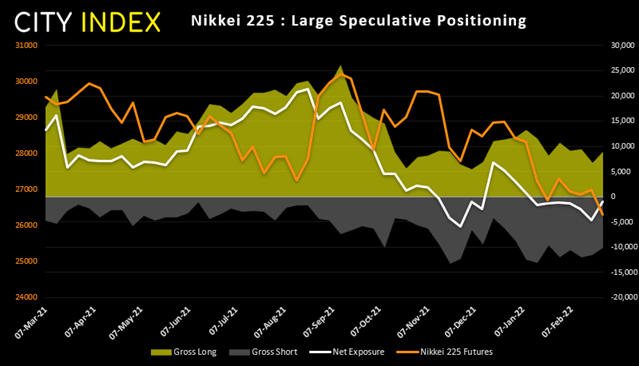
Traders remained net-short Nikkei futures for a 24th consecutive week although they appear set to revert to net-long exposure. 1063 long contracts were added last week compared to just 129 short contracts, which means traders are their lease bearish on Nikkei future since e ned of November. Separately, foreign investors were net sellers of stocks (¥261.9 billion) and were net buyers of binds (¥939.8 billion).
Nikkei 225:
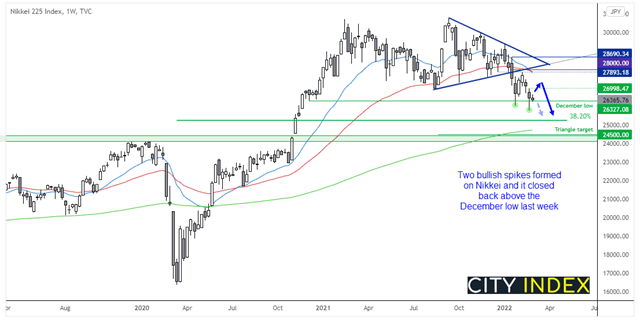
The Nikkei fell to a 14-month low last week, in line with its bearish breakout from the multi-week triangle. It projects a target around 24,500 although the 200-week eMA sits just below 25k and may make a more viable target for bears. However, a potential bullish hammer formed which would be confirmed with a break above 27k, and it closed back above the December low and two bullish spikes have formed to show demand below that key level. Whether it can rally from here hinges upon how far the war with Russia escalates. Should we avoid a nuclear fallout then it does pave the way open for a bounce as a lot of the shock and awe from last week has been priced in.
How to trade with City Index
You can easily trade with City Index by using these four easy steps:
-
Open an account, or log in if you’re already a customer
• Open an account in the UK
• Open an account in Australia
• Open an account in Singapore
- Search for the company you want to trade in our award-winning platform
- Choose your position and size, and your stop and limit levels
- Place the trade
Latest market news
Yesterday 01:32 PM
Yesterday 09:35 AM
Yesterday 07:23 AM
Yesterday 04:48 AM
Yesterday 12:17 AM
July 25, 2024 10:39 PM
Latest Indices articles

July 25, 2024 01:30 PM

July 25, 2024 01:01 AM

July 25, 2024 12:41 AM

July 24, 2024 07:26 PM