


November 10, 2022 8:02 PM

The Bank of Mexico stuck to the script and hiked rates by the same amount as the US Federal Reserve, 75bps, to bring its overnight rate to 10%. In doing so, Banxico has now hiked rates by 75bps for the 4th consecutive time, just as the US Fed has done. There was 1 dissenter who only voted for a 50bps increase. Banxico marginally downgraded its forecasts for short-term headline inflation to 8.4%, while it increased its forecasts for core inflation. Inflation is now expected to converge to the 3% target in the third quarter of 2024 vs a previous target of the first quarter 2024.
On a weekly timeframe, USD/MXN has been moving lower since making highs in April 2020 near 25.7836. The pair has been in a descending triangle formation with a base between 19.5491 and 19.8917. Each time price would hit the support area, it would bounce towards the downwards sloping trendline of the triangle, making a lower high each time. Price only pierced through this zone 2 times, on May 30th and June 6th, however it bounced back into the triangle both times. On October 21st, USD/MXN fell below the 20.0000 level and hasn’t returned to that level since. Today, after the weaker than expected CPI data from the US, USD/MXN continued to move lower and took out the May 30th lows at 19.4135, reaching an intraday low of 19.3347. If the pair closes below the May 30th low of 19.4136, there is room for price to fall to 18.5234, the lows from February 2020.
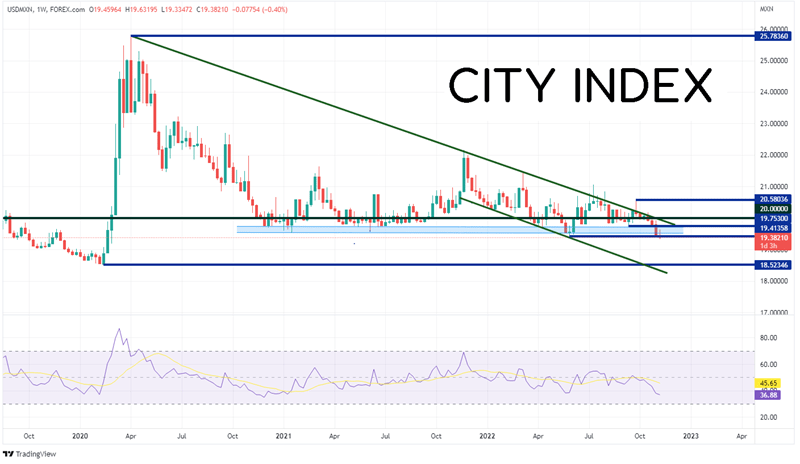
Source: Tradingview, Stone X
Trade USD/MXN now: Login or Open a new account!
• Open an account in the UK
• Open an account in Australia
• Open an account in Singapore
On a daily timeframe, the aggressiveness of Banxico shows that USD/MXN continues to hold below the 19.4135 level. If it continues lower, first support is at the 161.8% Fibonacci extension from the lows of September 12th to the highs of September 28th, near 19.2417. There isn’t any major support below there until the previously mentioned February 2020 lows at 18.5234, then the bottom trendline of the shorter-term timeframe near 18.3231. However, if USD/MXN bounces, the first resistance is at the previous lows of 19.4136, then the highs from November 9th at 19.6320. Above there, price can move to the lows of September 12th at 19.7530.
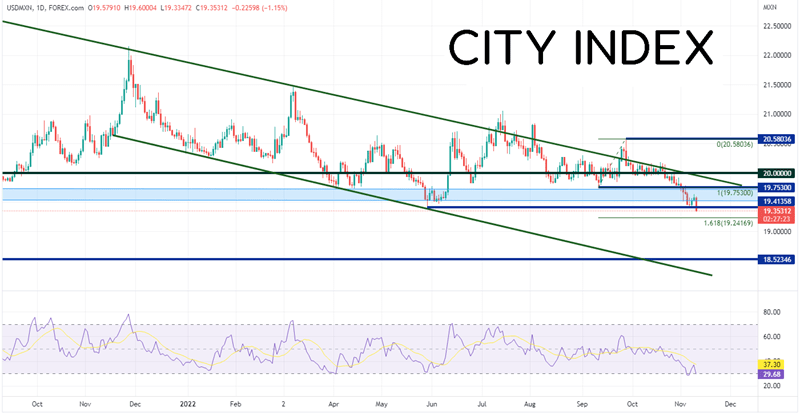
Source: Tradingview, Stone X
If the US continues to have lower inflation readings, the FOMC may only hike 50bps at the December meeting. However, will Banxico follow with a hike of only 50bps at its next meeting on December 15th (a day after the FOMC meeting)? It may depend on whether Mexico’s inflation increases or falls in November.
Learn more about forex trading opportunities.
Latest market news
Yesterday 01:32 PM
Yesterday 09:35 AM
Yesterday 07:23 AM
Yesterday 04:48 AM
Yesterday 12:17 AM
July 25, 2024 10:39 PM
Latest Trade Ideas articles

Yesterday 09:35 AM

Yesterday 12:17 AM

July 25, 2024 10:39 PM

July 25, 2024 05:30 PM