


September 6, 2022 9:00 PM

The Bank of Canada meets on Wednesday to decide how much the central bank should raise interest rates. It really isn’t a question as to “if” they will raise interest rates as to “by how much” they will raise rates. At the last meeting, the BOC surprised markets and hiked 100bps to 2.50%. Expectations were only for 75bps. Could they do it again? At the time, the BOC said that the reason for such an aggressive hike was that the committee thought that inflation had become more persistent than they had expected at the April Monetary Policy Report. They noted that inflation would remain near 8% over the next few months. They also cut 2022 and 2023 GDP as tighter financial conditions would cool pent-up demand.
Everything you wanted to know about the BOC
Since then, both inflation and GDP have been weak. On August 16th, data showed that Canada’s headline CPI for July was 7.6% YoY vs a June reading of 8.1% YoY and expectation of 7.6%. In addition, the Core CPI print was 6.1% YoY vs a previous reading of 6.2% YoY. On August 31st, Canada released its Q2 GDP. The print was 3.3% vs a previous reading of 3.1%. However, the expectation was 4.4%! The Manufacturing PMI was also weak, released September 1st. The August reading was 48.7 vs a prior reading of 52.5 and an expectation of 51. Note that readings under 50 are considered contractionary for the economy.
Expectations after the July meeting were high for another 100bps hike. However, as more and more economy data was released, expectations dropped to 75bps for Wednesday’s meeting. Unfortunately, markets won’t get a look at August’s Employment data until after the BOC meeting, however expectations are for a small increase of 15,000 vs a horrible July reading of -30,600.
USD/CAD has been trading in a rising channel since the early spring. On July 14th, the pair traded above the 1.3077, which had acted as previous resistance 3 times since May 12th. USD/CAD reached an intraday high of 1.3224 however, pulled back within the channel. As is often the case, when price fails to break out of one side of a pattern, it often moves to test the opposite side of the pattern. USD/CAD pulled back in a descending wedge formation and traded to the bottom trendline of the channel near 1.2728 as price broke above the wedge. Since then, USD/CAD continued to move back above the prior resistance and is nearing the 1.3224 level once again. Those July 14th highs act as the first level of resistance. Above there, price can move to horizontal resistance at 1.3299 (November 4th, 2020 highs) and then the top trendline of the channel near 1.3365. However, if the BOC is more hawkish than expected and USD/CAD moves lower, first support is at the August 25th lows of 1.2885, then the bottom trendline of the channel near 1.2790. If price breaks below there, the pair can move to the August 11th lows at 1.2727.
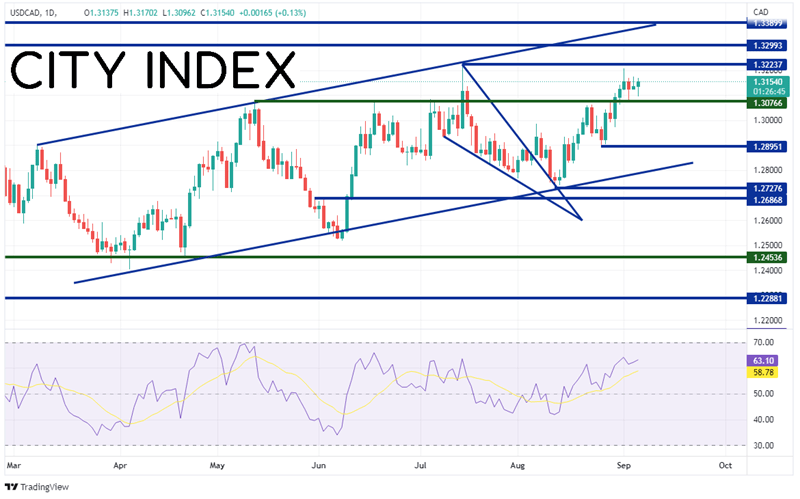
Source: Tradingview, Stone X
Trade USD/CAD now: Login or Open a new account!
• Open an account in the UK
• Open an account in Australia
• Open an account in Singapore
Will the Bank of Canada raise rates by 75bps? Most likely. With the economic data worse since the last meeting, BOC members may not wish to be as aggressive. However, watch the statement for the details. If the statement is more hawkish leaning, USD/CAD may be headed lower. However, if it is more dovish, price may break above the 1.3224 level in a hurry!
Learn more about forex trading opportunities.
Latest market news
Yesterday 01:32 PM
Yesterday 09:35 AM
Yesterday 07:23 AM
Yesterday 04:48 AM
Yesterday 12:17 AM
July 25, 2024 10:39 PM
Latest Trade Ideas articles

Yesterday 09:35 AM

Yesterday 12:17 AM

July 25, 2024 10:39 PM

July 25, 2024 05:30 PM