


Australian dollar and AUD/USD takeaways
- Today’s US data showed that the long-awaited slowdown in the US economy may finally be at hand, an ominous sign for risk assets like the Australian dollar.
- AUD/USD has reversed aggressively off the top of its multi-month range at 0.6800.
- The contained price action provides short-term opportunities for readers who prefer trading ranges.
AUD/USD fundamental analysis
This morning’s US data showed that the long-awaited slowing of the US economy may finally be at hand. Producer prices fell from 2.7% y/y last month down to 2.3%, a reading that also came in below the 2.4% print that economists were expecting. At the same time, the US initial unemployment claims report showed an unexpected surge to 264K (vs. 245K) expected; while this reading is still relatively low historically, it has been consistently rising since the start of April, signaling that the labor market may finally be loosening.
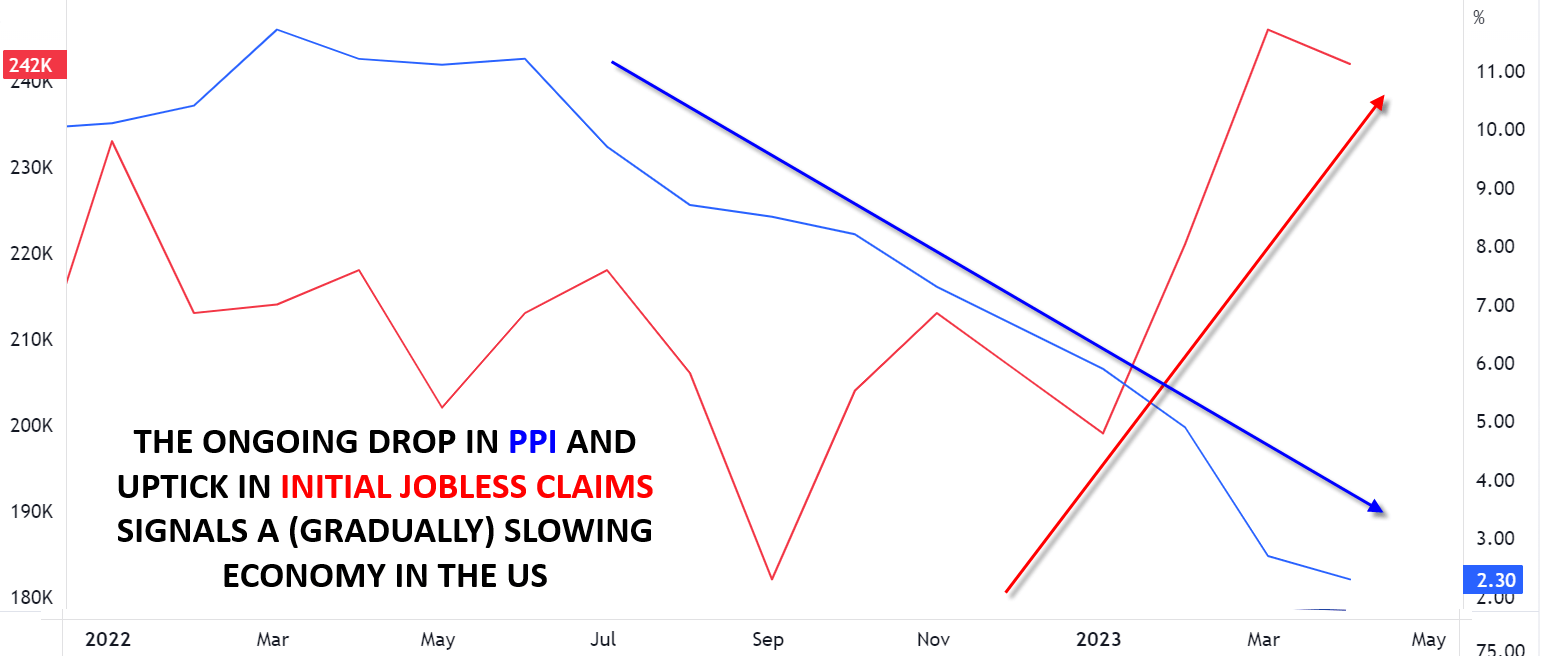
Source: Tradingview, StoneX
As is often the case with the world’s largest economy, US economic weakness is actually leading to strength in the US dollar today. Traders often say that “If the US sneezes, the world catches a cold,” and at the end of the day, any weakness in the US economy is likely to spread to other regions, stoking demand for the world’s reserve currency. In particular, risk-appetite-sensitive assets, including commodity currencies like the Canadian and Australian dollars, are seeing strong selling pressure.
Australian Dollar technical analysis– AUD/USD Daily Chart
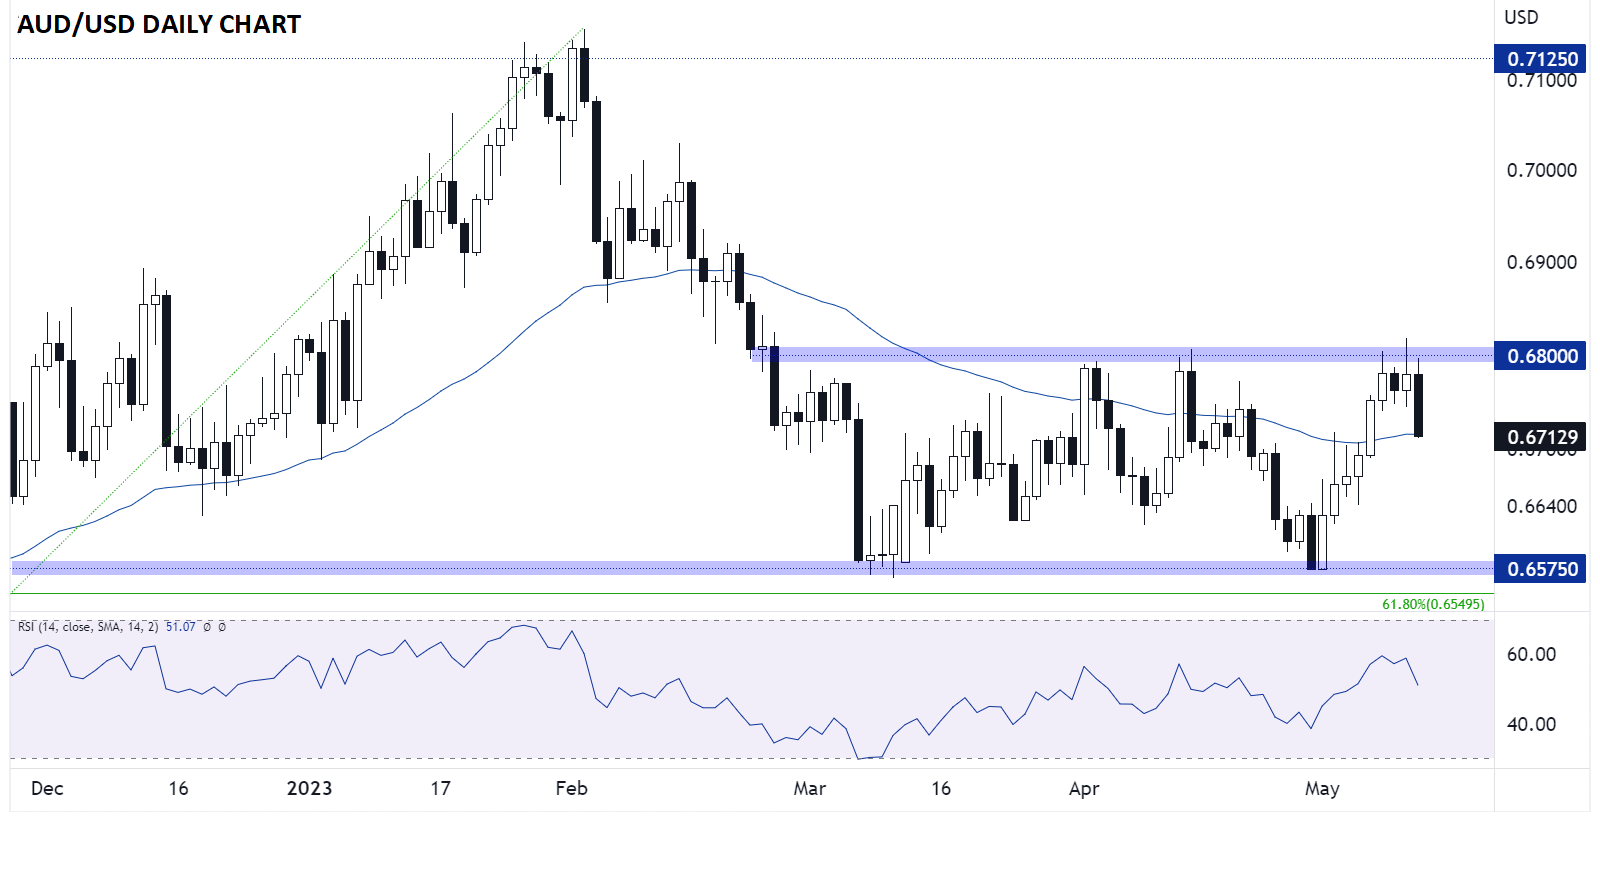
Source: Tradingview, StoneX
As the AUD/USD chart above shows, the Australian dollar is rolling over strongly today after testing its range high near 0.6800. The cross-Pacific cross has been trapped within a roughly 200-pip range between 0.6800 and 0.6575 going back to late February, and with today’s big bearish move (the biggest percentage decline since early March if it holds), that range looks likely to hold for a bit longer.
Moving forward, there’s little in the way of strong, clear support until back at the bottom of the range near 0.6600. The contained price action provides short-term opportunities for readers who prefer trading ranges, while longer-term swing and position traders may want to wait for a confirmed breakout to signal the direction of the next major trend.
-- Written by Matt Weller, Global Head of Research
How to trade with City Index
You can trade with City Index by following these four easy steps:
-
Open an account, or log in if you’re already a customer
• Open an account in the UK
• Open an account in Australia
• Open an account in Singapore
- Search for the market you want to trade in our award-winning platform
- Choose your position and size, and your stop and limit levels
- Place the trade
Latest market news
Yesterday 11:57 PM
Yesterday 08:00 PM
Yesterday 02:00 PM
April 27, 2024 11:00 PM
Latest AUD/USD articles


April 24, 2024 02:03 AM

April 22, 2024 10:40 PM

April 18, 2024 02:40 AM