


November 10, 2021 11:04 PM

AUD/USD has had 3 bearish engulfing candlesticks on the daily timeframe since running into an upward sloping trendline and the 200 Day Moving Average near .7555 on October 29th. This may have initially had to do with US Dollar profit taking into month end, but on November 3rd, even though the RBA dissolved its yield curve control program, the central bank failed to communicate to the markets that this was their attempt to make them seem less dovish.
Trade AUD/USD now: Login or Open a new account!
• Open an account in the UK
• Open an account in Australia
• Open an account in Singapore
And as my colleague Tony Sycamore pointed out yesterday, the better than expected NAB business confidence survey and Westpac Consume Sentiment failed to give a bid to the Aussie. In addition, the stronger than expected US inflation report helped push the pair below the 50-Day Moving Average. However, AUD/USD is closing in on horizontal support and the 61.8% Fibonacci retracement from the October 1st lows to the October 29th highs near 0.7317. The next support is at the upward sloping trendline of the channel near 0.7250, ahead of the October 1st lows at 0.7170. Resistance above is at the 50 Day Moving Average near 0.7366, horizontal resistance at 0.7480, and the 200 Day Moving Average at 0.7546.
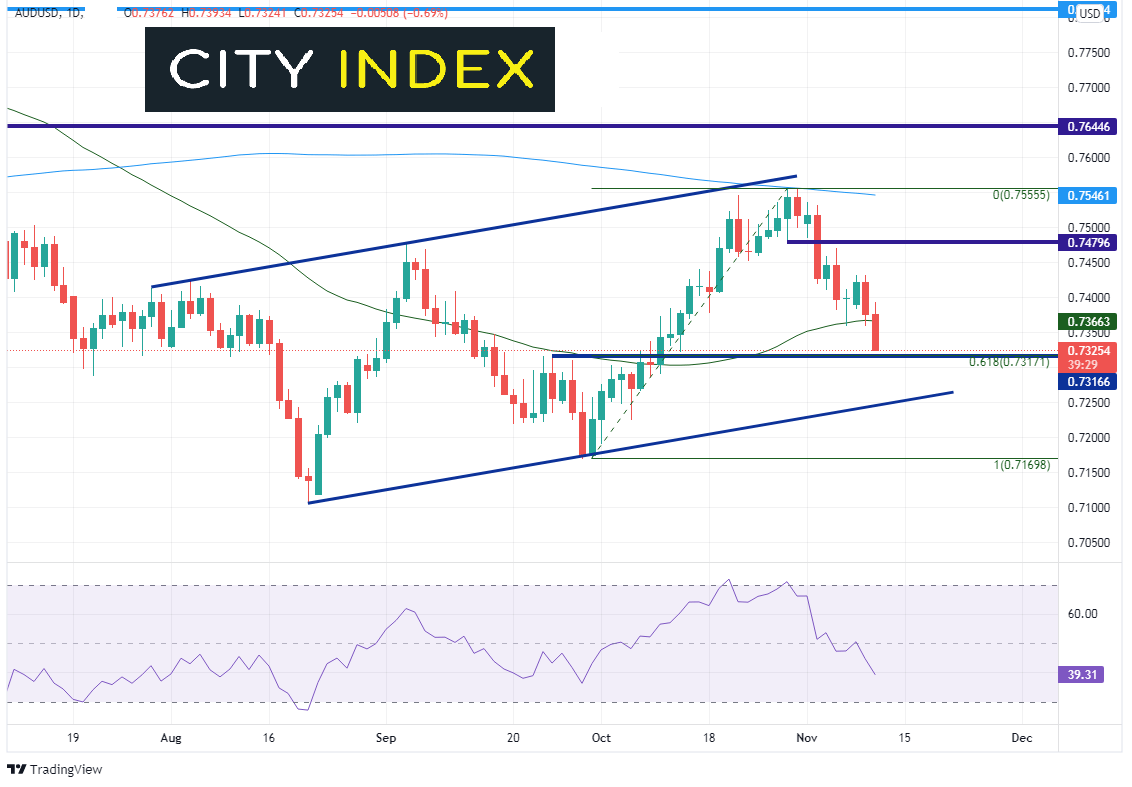
Source: Tradingview, Stone X
The RBNZ raised interest rates from 0.25% to 0.5% on October 6th. This is in line with expectations; however, the committee was also hawkish. With stronger than expected economic data recently out of New Zealand, including Q3 GDP and Employment data, some are expecting as much as a 50bps rate hike when they meet again on November 24th. From the low on October 6th to the rent high on October 24th, NZD/USD rallied from 0.6876 to 0.72185. Since then, the pair has been consolidating in what appeared to be a flag formation.
Trade NZD/USD now: Login or Open a new account!
• Open an account in the UK
• Open an account in Australia
• Open an account in Singapore
However, as with AUD/USD, the strong US Dollar on Wednesday (thanks to the CPI data) pushed NZD/USD below the bottom trendline of the flag formation, below the 38.2% Fibonacci retracement from October 6th to October 24th, below the 200 Day Moving Average, and below the 50% retracement of the previously mentioned timeframe, as the pair lost nearly 70 pips. Support below is at a long-term downward sloping trendline from March 2020 near 0.7050 and the 61.8% Fibonacci retracement near 0.7028. Resistance isn’t until Wednesday’s highs near 0.7133!
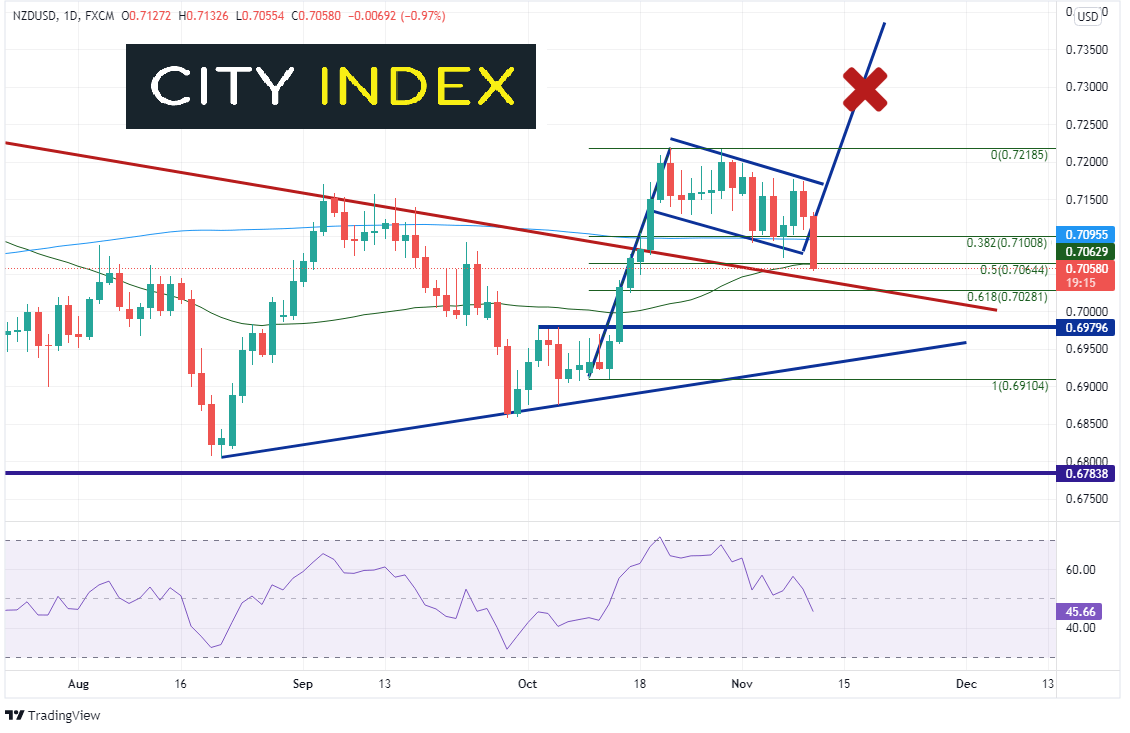
Source: Tradingview, Stone X
With both AUD/USD and NZD/USD moving lower on Wednesday, is it better to be long the Aussie or the Kiwi? AUD/NZD had been in a strong downtrend from mid-June until the end of September. On September 27th, the pair moved higher above the downward sloping channel and retraced to the 61.8% Fibonacci level from the June 21st highs to the September 16th lows near 1.0609. However, after Australia released its September Employment Change of -138,000, it became more evident who would be hiking rates first, as the strong New Zealand inflation data confirmed that it would be New Zealand. AUD/NZD moved lower in a flag formation, reaching its target earlier in the week at 1.0330. Further support is at the September 16th lows of 1.0280. If price falls below there, it can easily fall to trendline support near 1.0107 and then the March 2020 lows near 1.000.
Trade AUD/NZD now: Login or Open a new account!
• Open an account in the UK
• Open an account in Australia
• Open an account in Singapore
However, did price fall too much? With the recent stronger Australian data, will AUD/NZD begin moving higher? In the short-term there is room for AUD/NZD to move higher, however price would have to overcome strong horizontal resistance above and the 50 Day Moving Average near 1.0427 if it wanted to continue. Above there, resistance is at the top of the flag at 1.0528 and then the highs from October 13th at 1.0610.
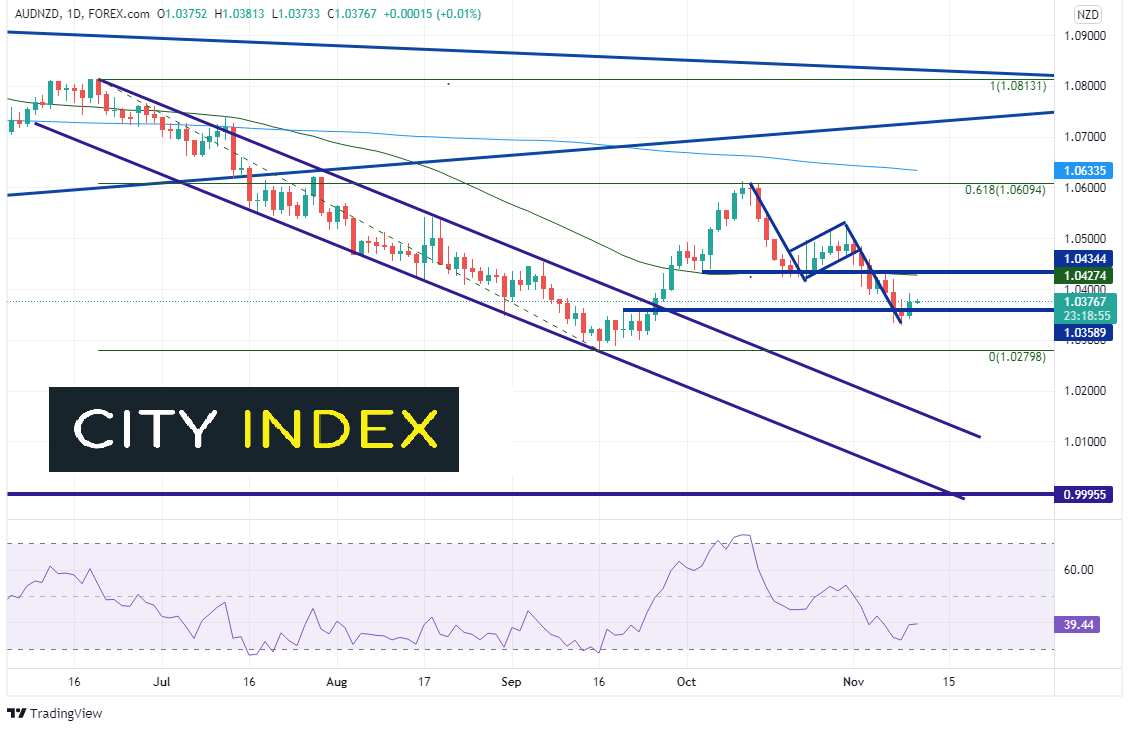
Source: Tradingview, Stone X
The Australian Dollar has been hit hard lately, as AUD/USD is reaching its lowest level in nearly a month. However, NZD/USD has been drifting lower as well, with the pair down nearly 1% on Wednesday. If Australian data continues to be better than expected, AUD/NZD may go bid as the Aussie plays catch-up. 1.0427 is the key level it must hold above. However, if Australian data is weaker, AUD/NZD may break below key support at 1.0278, and a lot lower if the pair closes below there!
Learn more about forex trading opportunities.
Latest market news
Yesterday 01:32 PM
Yesterday 09:35 AM
Yesterday 07:23 AM
Yesterday 04:48 AM
Yesterday 12:17 AM
July 25, 2024 10:39 PM
Latest Trade Ideas articles

Yesterday 09:35 AM

Yesterday 12:17 AM

July 25, 2024 10:39 PM

July 25, 2024 05:30 PM