


July 27, 2022 3:50 AM

June quarter Australian inflation data has surged to 6.1%, but below consensus expectations easing fears of a supersized 75bp rate hike when the RBA meets next week.
Headline CPI rose by 1.8% QoQ and 6.1% YoY. This was the highest reading since the introduction of the Goods and Services tax in the early 2000s.
The RBA's preferred measure of inflation, the trimmed mean, increased by 1.4% QoQ and 4.9% YoY, above the market's expectations of 1.2%QoQ and 4.7%yoy.
Core inflation is now 190bp above the top of the RBA's 2-3% target band, and the annual trimmed mean was the highest since the ABS first published the series in 2003.
The most significant price rises were in
- New Dwelling purchases by owner-occupiers (+5.6%) driven by high building construction activity, combined with ongoing materials and labour shortages
- Automotive fuel (+4.2%) rose for the eighth consecutive quarter
- Furniture (+7.0%) due to increased transport and manufacturing costs.
- Vegetables (+7.3%) rose due to heavy rain flooding in Queensland and New South Wales, damaging crops and farm infrastructure.
While the trend of higher inflation towards the RBA's 7% target remains intact, the softer than expected headline print has prompted the interest rate market to erase all chances of a 75bp rate hike.
In its place, the interest rate market is cleanly priced from a 50bp rate hike when the RBA meets on Tuesday which would take the cash rate to 1.85%. The real surprise would be the delivery of a 25bp rate hike.
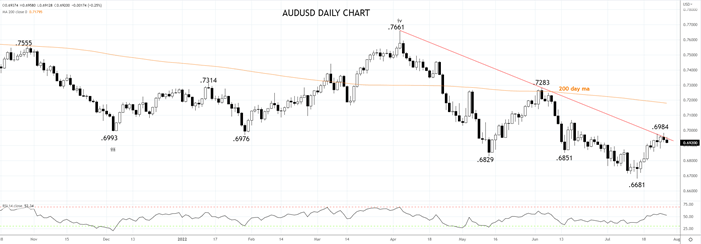
Following the release, the AUDUSD fell from .6950 to a low of .6917, retreating from the resistance band at .6960/85, which includes the downtrend from April 2022 .7661 high.
While the AUDUSD remains below .6960/85 (closing basis), the downtrend remains intact. Aware that a sustained break/close at the end of this week (Post FOMC and Q2 US GDP) above .6985c would be an initial indication a tradable low is in place at .6681 and that a more substantial rally can develop.
Source Tradingview. The figures stated are as of July 27th ,2022. Past performance is not a reliable indicator of future performance. This report does not contain and is not to be taken as containing any financial product advice or financial product recommendation
How to trade with City Index
You can trade with City Index by following these four easy steps:
-
Open an account, or log in if you’re already a customer
• Open an account in the UK
• Open an account in Australia
• Open an account in Singapore
- Search for the company you want to trade in our award-winning platform
- Choose your position and size, and your stop and limit levels
- Place the trade
Latest market news
Yesterday 01:32 PM
Yesterday 09:35 AM
Yesterday 07:23 AM
Yesterday 04:48 AM
Yesterday 12:17 AM
July 25, 2024 10:39 PM
Latest Inflation articles

July 15, 2024 04:21 PM

July 12, 2024 01:32 AM
July 12, 2024 01:32 AM

July 9, 2024 04:52 PM