


Whilst Jerome Powell hawkish comments have weighed on sentiment this week , the Nasdaq 100 is holding up pretty well at just -0.6% lower. Add into the mix that March tends to generate positive returns and the charts are providing multiple bullish clues, we suspect the Nasdaq can outperform Wall Street, should sentiment turn back in favour for equity traders.
A (very) hawkish Powell has weighed on sentiment this week
Jerome Powell’s testimony to the House and Senate Committee’s was littered with hawkish comments, which sent US yields soaring higher, dragging the US dollar with it and weighing on global equities. But when we consider that Fed Fund futures are now pricing in a 50bp hike and a higher terminal rate of 5.75%, Wall Street is actually holding up pretty well. The Nasdaq is down just -0.6% this week so far, which is better than the S&P 500’s -1.6% fall and the Dow’s -1.7% decline. And that means it could outperform its peers if sentiment is given another boost.
Cautiously bullish the Nasdaq
If we look at the top 10 stocks of the Nasdaq by Market Cap, the majority of them trade within choppy ranges on the daily chart. On one hand it shows a floor in place for prices, but on the other we should probably cap our expectations for any runaway gains on the broader index. With that said, Meta and Nvidia are two that show the most bullish structure on the daily chart.
And if we’re to see a surprise miss on Friday’s NFP, it could further support stocks as traders question the likelihood of such an aggressive hike. Furthermore, Powell did not explicitly say that a 50bp is on the cards, which leaves room for disappointment if it ends up being a mere 25bp hike. With NFP and inflation data due ahead of their next meeting then there’s plenty of room for things to change. And that’s why we are cautiously bullish on the Nasdaq.
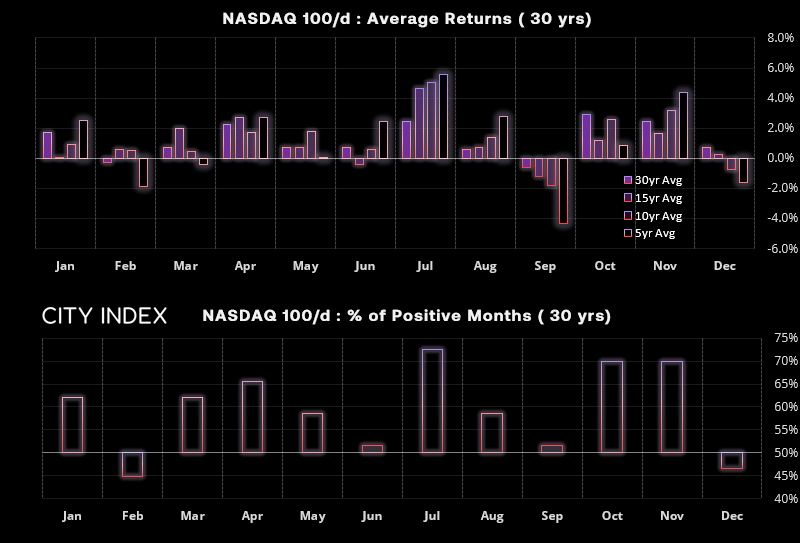
March tends to be a profitable month for the Nasdaq
If we look back at the past 30 years of data, we can see that the Nasdaq posted an average positive return in March of 0.7%, and it closed higher that month 62.1% of the time. March also has the second highest high-low range average, with February being the most volatile range. With the Nasdaq currently down for the month, perhaps we’re nearing the phase where bulls step back in.
Nasdaq 100 weekly chart:
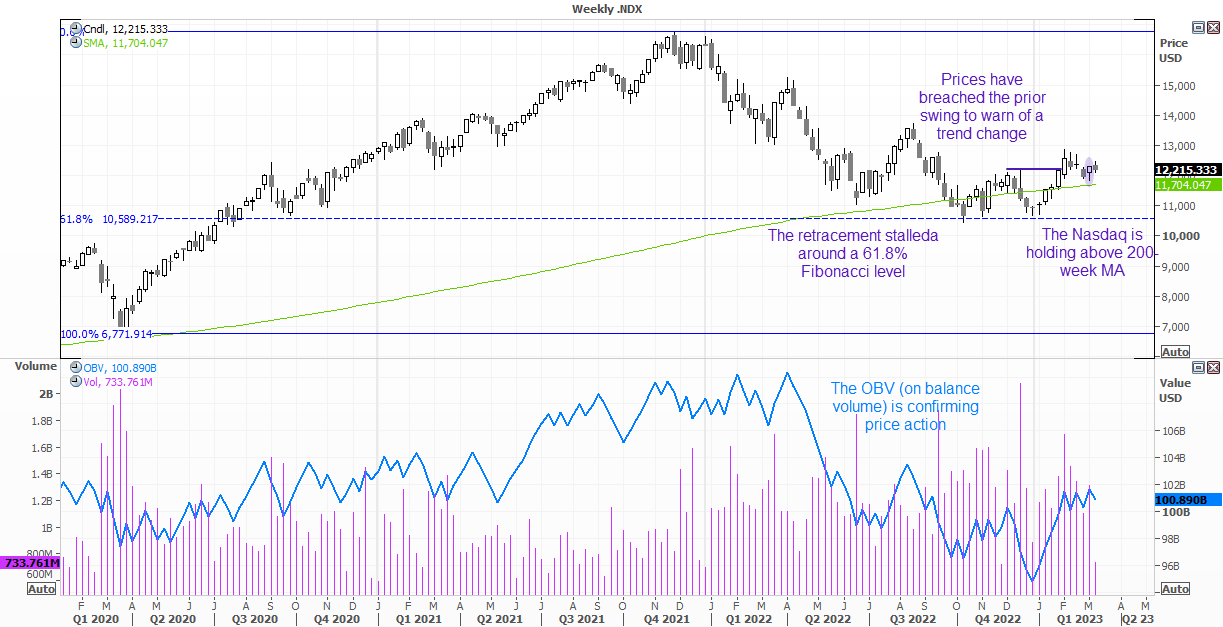
A few interesting things stand out on the weekly chart. Firstly, the retracement from the record high stalled around the 61.8% retracement level between the pandemic low and all-time high. Also notice how a triple bottom formed along the Fibonacci level and momentum is slowly turning higher. Furthermore, prices have risen above a previous swing high to warn of a change in trend, its subsequent pullback held above the 200week MA with a small bullish hammer, and the OBV indicator (on balance volume) is confirming the bullish move. Overall, it’s possible we have seen the corrective low from the bear market.
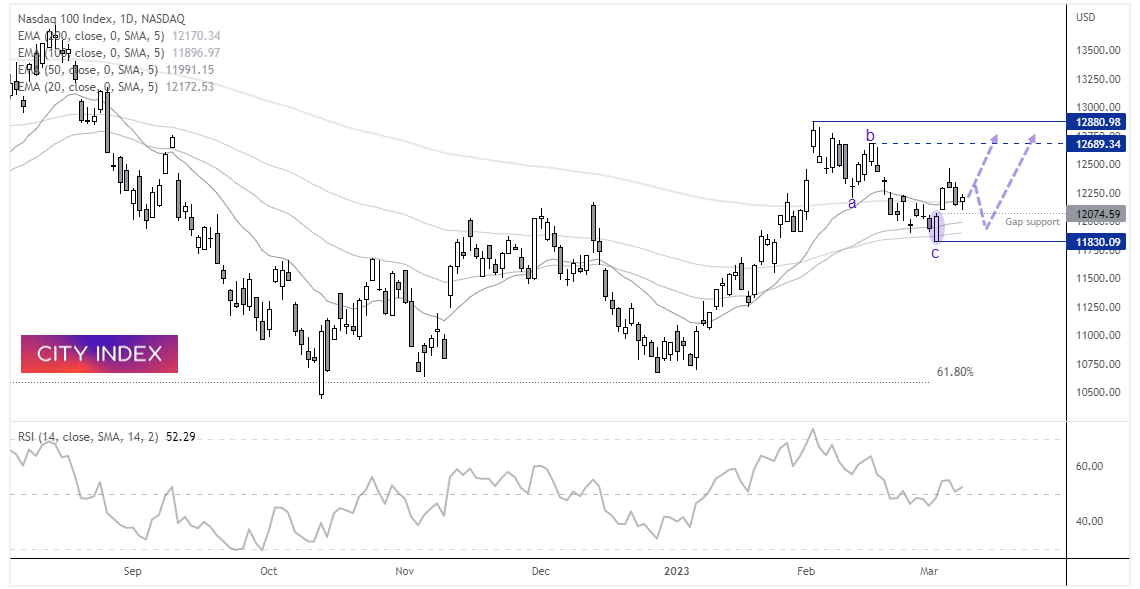
Nasdaq 100 daily chart:
The daily chart also displays a subtle bullish structure. Its pullback from the February high came in three wavers (ABC correction), before a bullish engulfing candle formed a prominent swing low. Prices broke above the 20, 50, 100 and 200-day EMA’s and are now holding above them, and yesterday’s small bullish candle held above gap support. RSI (14) is also above 50 and confirming price action.
- The bias remains bullish above 11,830 and for a retest of the 12,689 and 12,880 highs
- If prices hold above 12,700 / gap support today, bulls could consider tighter risk management
- If prices break below gap support, we would reconsider bullish setups above the 12,830 low
Of course, the main downside risks for the Nasdaq (and Wall Street in general) is if we see another abnormally strong Nonfarm payroll report and inflation comes in hotter than liked next week, equity traders get the memo that the Fed mean business and stocks sell off. This is why our line in the sand to invalidate the bullish bias is the 11,830.09 low.
-- Written by Matt Simpson
Follow Matt on Twitter @cLeverEdge
How to trade with City Index
You can trade with City Index by following these four easy steps:
-
Open an account, or log in if you’re already a customer
• Open an account in the UK
• Open an account in Australia
• Open an account in Singapore
- Search for the market you want to trade in our award-winning platform
- Choose your position and size, and your stop and limit levels
- Place the trade
Latest market news
Yesterday 01:32 PM
Yesterday 09:35 AM
Yesterday 07:23 AM
Yesterday 04:48 AM
Yesterday 12:17 AM
July 25, 2024 10:39 PM
Latest Trade Ideas articles

Yesterday 09:35 AM

Yesterday 12:17 AM

July 25, 2024 10:39 PM

July 25, 2024 05:30 PM