


December 23, 2021 3:32 AM

End of year markets can be extremely difficult to trade. EUR/USD is no exception. On one hand they can be extremely quiet as many big money funds have wrapped up trading for the year. Why risk losing profits as we head into the last two trading weeks of the year? These funds may have even been out of the market before the central bank meetings last week due to the uncertainty! However, on the other hand, there can also bursts of volatility due to the illiquid markets. If someone, such as a trader for a pension fund, needs to get a position on in a product, he or she can move the markets, as there may not be many traders on the opposite side of the trade. Therefore, when trading at year end, it is best to take a longer-term view of the markets. If traders use smaller positions and wider stops, they are less likely to get taken out by any volatility.
EUR/USD has been moving in a downward sloping channel since reaching May 26th. However, the pair posted a false breakdown at the bottom trendline of the channel in late November near the 61.8% Fibonacci retracement level from the low of March 2020 to the high of January 2021, at 1.1292. However, since bouncing back into the channel, EUR/USD has been moving sideways between 1.1222 and 1.1383.
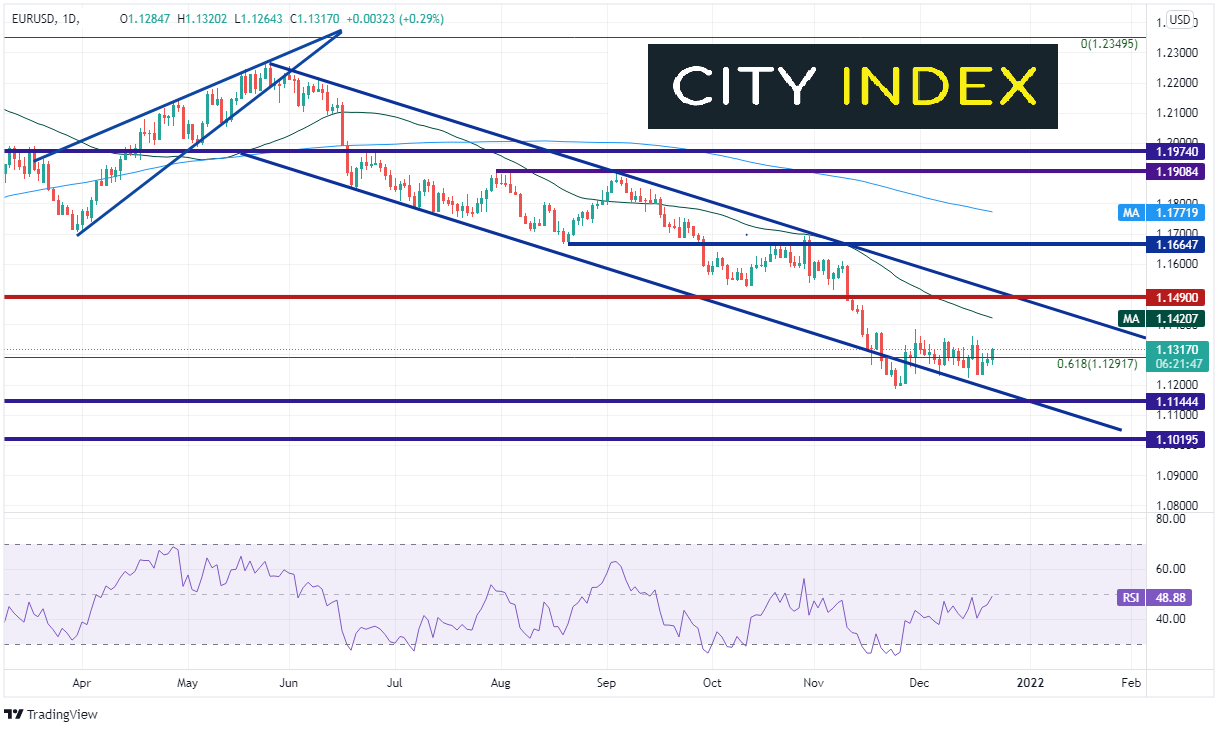
Source: Tradingview, Stone X
Trade EUR/USD now: Login or Open a new account!
• Open an account in the UK
• Open an account in Australia
• Open an account in Singapore
On a 240-minute timeframe, EUR/USD is consolidating in a symmetrical triangle. This makes sense given the quiet nature of trading at this time of year. However, if there is a burst of volatility higher or lower, below are some important levels to watch for price to pause or reverse:
Resistance
- 1.1383/1.1395: This level horizontal resistance from the top of the triangle and the 50% retracement from the highs of November 9th to the lows of November 24th.
- 1.1420: 50 Day Moving Average (see daily)
- 1.1446: 61.8% Fibonacci retracement from the recently mentioned timeframe
- *1.1490/1.1500:Strong long-term resistance and psychological round number resistance (See daily)
Support
- 1.1182: November 24th lows
- *1.1145: long-term horizontal support dating back to March 2020 (see daily)
- *1.1020: long-term horizontal support dating back to May 2020 (see daily)
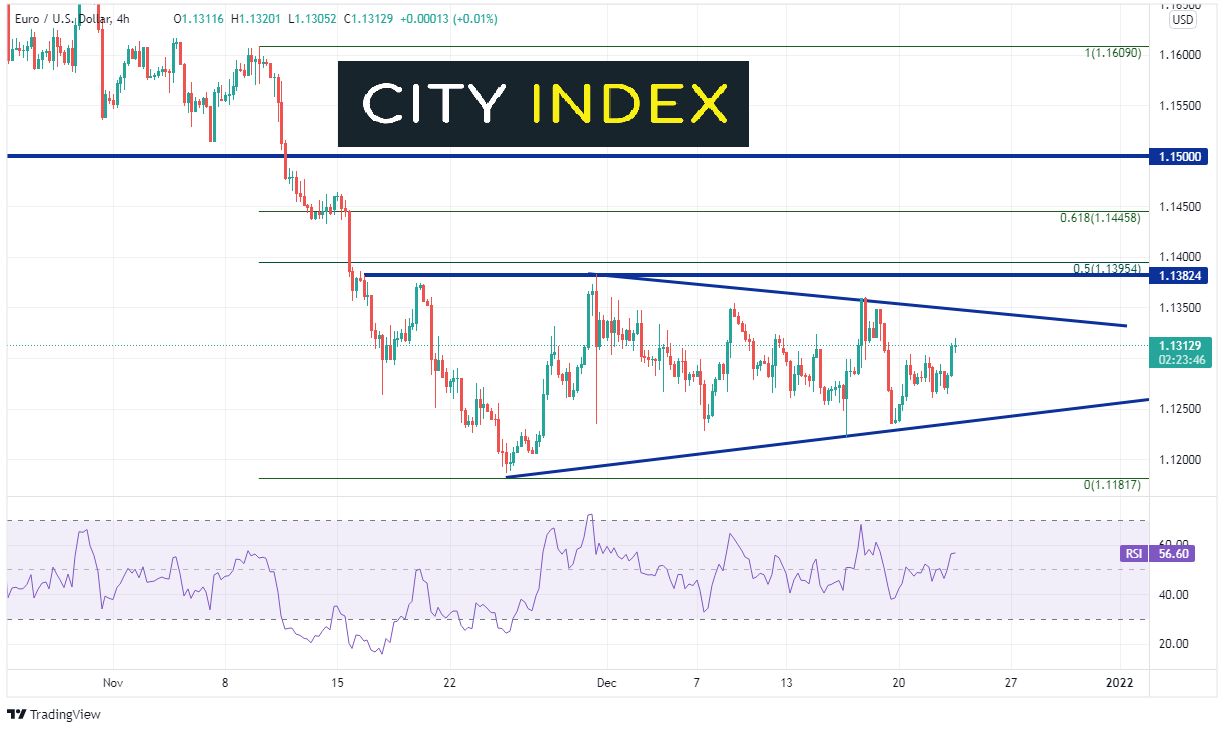
Source: Tradingview, Stone X
When trading at the end of year, best risk management practices should be to trade smaller size and have wider stops than at other times of the year. Trading EUR/USD is no exception. Watch for quiet price action with possible busts of volatility which could move the pair quickly to resistance or support!
Learn more about forex trading opportunities.
Latest market news
Yesterday 01:32 PM
Yesterday 09:35 AM
Yesterday 07:23 AM
Yesterday 04:48 AM
Yesterday 12:17 AM
July 25, 2024 10:39 PM
Latest Forex articles

Yesterday 12:17 AM

July 25, 2024 10:39 PM

July 25, 2024 03:59 PM

July 25, 2024 04:37 AM